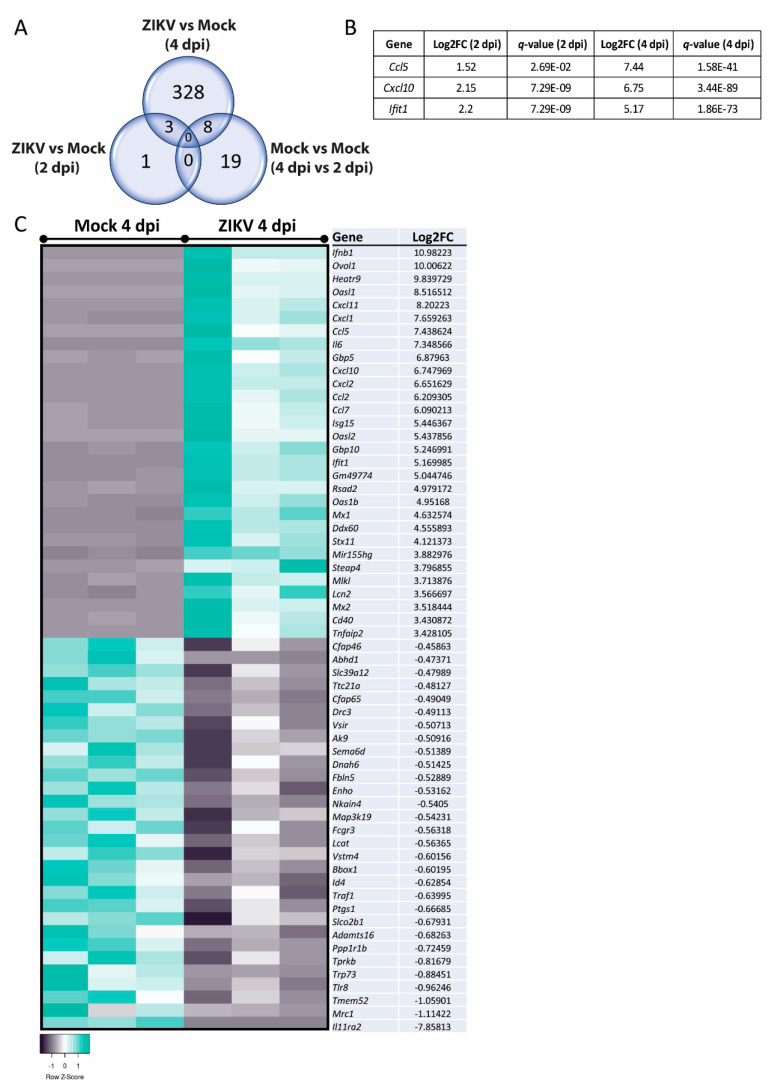
Figure 4.
Ccl5, Cxcl10, and Ifit1 were upregulated in mature CNS cultures at 2 dpi and 4 dpi. (A) Comparison of differentially expressed genes (DEGs) in ZIKV-infected versus mock-infected mature CNS cultures, at 2 dpi and 4 dpi; there were 19 DEGs unique to the dataset comparing mock-infected cultures at 4 dpi with mock-infected cultures at 2 dpi. (B) ZIKV-infected cultures shared three DEGs; Ccl5, Cxcl10, and Ifit1, with upregulation data shown in the table. (C) The transcriptomic analysis of independent biological replicates (n = 3) of ZIKV-infected mature CNS cultures at 4 dpi revealed more than 300 DEGs with a q-value < 0.05. The heatmap displays the top 30 up- or downregulated genes between mock- and ZIKV-infected mature CNS cultures. The heatmaps were generated with the online tool Heatmapper [77].

