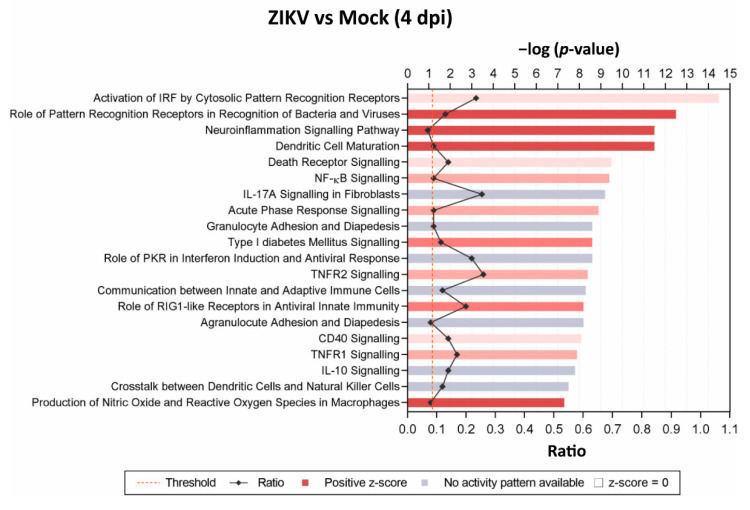
Figure 5.
Identification of top 20 significant canonical pathways affected at 4 dpi in mature CNS cultures. Comparison of ZIKV-infected versus mock-infected mature mouse CNS culture by Ingenuity Pathway Analysis (IPA). Cellular pathways are indicated. Bars are measured against −log(p-values). The intensity of the color (red) correlates with z-score positivity. Positive z-scores indicate upregulated pathways, whereas negative z-scores are indicative of downregulation. Gray bars indicate that although a pathway is affected, the resulting activity (activation or repression) is unknown. The ratio reflects the number of molecules presented in the dataset that are involved in each pathway against the known total of pathway components.

