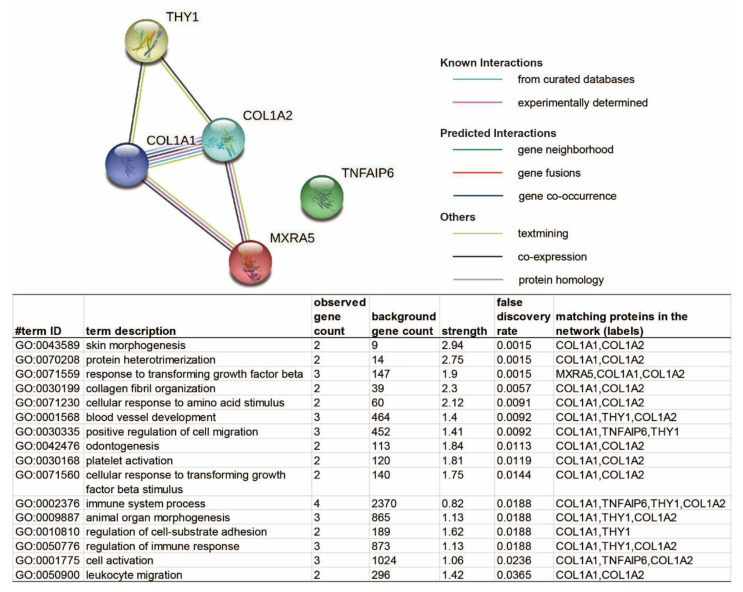
Figure 5.
The STRING server displayed the protein–protein interaction network among the five common OA-responsive DEGs, which have significantly different multiples of change in male and female cartilage. The network nodes represent proteins, while filled nodes are for the proteins with known or predicted 3D structures. Edges represent protein–protein associations. The list contains identified pathways with a false discovery rate (FDR) of less than 0.05.

