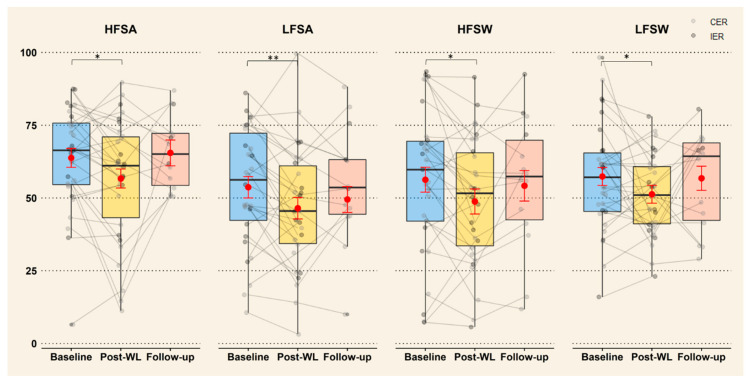
Figure 2.
Change in liking for all food categories after ≥5% WL and 1-year follow-up (n = 28). The individual data are represented by points (light grey for CER and dark grey for IER) and showed that there was no difference between diets. Estimated means from the mixed models are represented by red points with error bar (SE). Boxplots represent the variability of the data with the median (black line), interquartile range (colored box) and whiskers representing minimum/maximum (Q ± 1.5 x IQR). * Significant changes between baseline, post-WL and follow-up (* p < 0.05, ** p < 0.01), CER: continuous energy restriction, IER: intermittent energy restriction, HFSW: high-fat-sweet, HFSA: high-fat-savoury, LFSW: low-fat-sweet, LFSA: low-fat-savoury, WL: weight loss.

