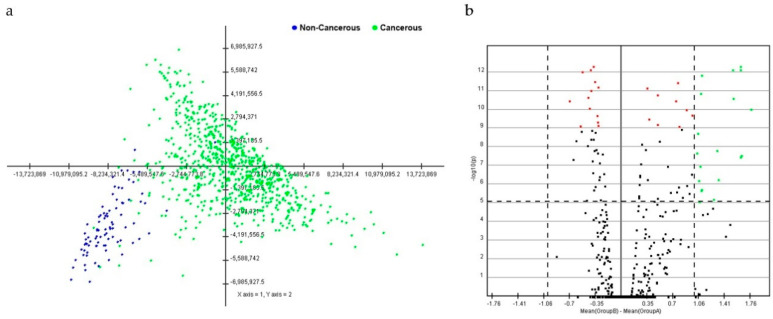
Figure 1.
Principal component analysis (PCA) score and volcano plot in breast cancerous and non-cancerous tissues. (a) In the score plot, each dot represents an individual, and is colored in accordance with the embedded legend. (b) Volcano plot of miRNAs between breast cancerous and non-cancerous tissues. Cutoff points for the p-value (<0.00001; −log10(0.00001) = 1) or mean difference (>1 or <−1) are indicated with dotted lines.

