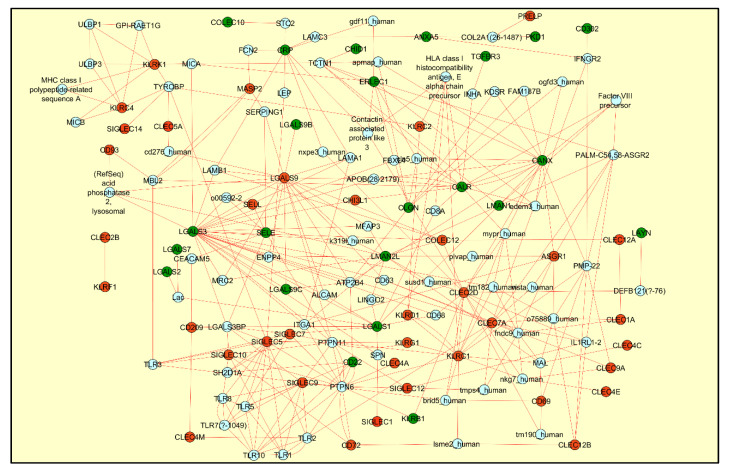
Figure 3.
The figure represents the induced network module generated for the differentially regulated lectins using CPDB database and visualized using Cytoscape network. Transcriptomics data from the SARS-CoV-2 infected human nasopharyngeal swab sample was used to highlight the graph with red color indicating upregulated genes and the green color indicating the downregulated genes. The protein–protein interaction network, drawn in red color, reveals the association of lectins with both the positive and negative immune regulatory pathways.

