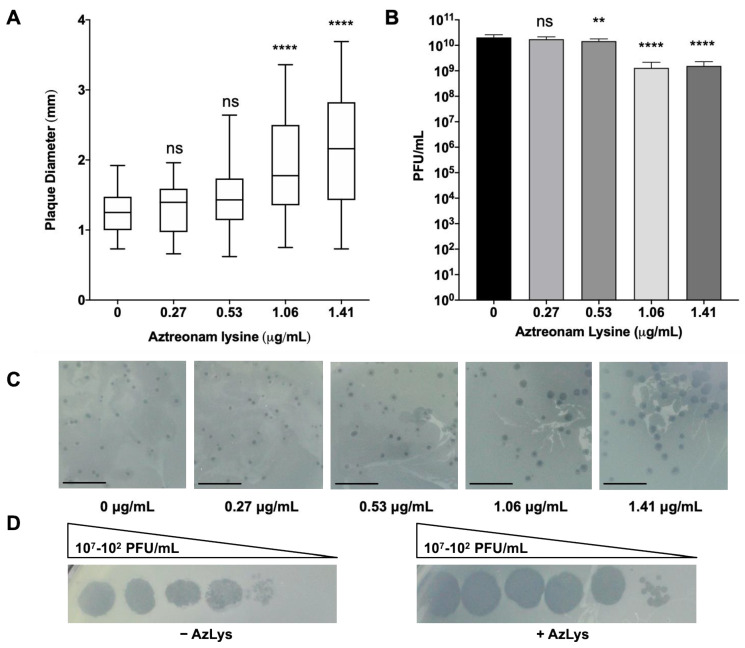
Figure 2.
E79 and aztreonam lysine (AzLys) exhibit phage–antibiotic synergy (PAS) on P. aeruginosa PA01. (A) Box plot of plaque diameter, and (B), bar chart of average phage titer, of phage E79 in the presence of different concentrations of sub-inhibitory AzLys determined by a modified double agar overlay assay. Results are from three separate trials, with error bars representing the (A) largest and smallest plaque diameter and (B) standard deviation. Statistical analysis was performed using a one-way ANOVA with Dunnett’s post-test compared to the control (**, p < 0.01; ****, p < 0.0001; ns, not significant). (C) Visual representation of E79 plaque morphology at increasing AzLys concentrations. All images were photographed at identical magnifications. Scale bars equal 20 mm. (D) Infection efficiency of E79 in the absence (-) or (+) presence of 1.06 μg/mL AzLys. Images are representative of three biological replicates, each with three technical replicates.

