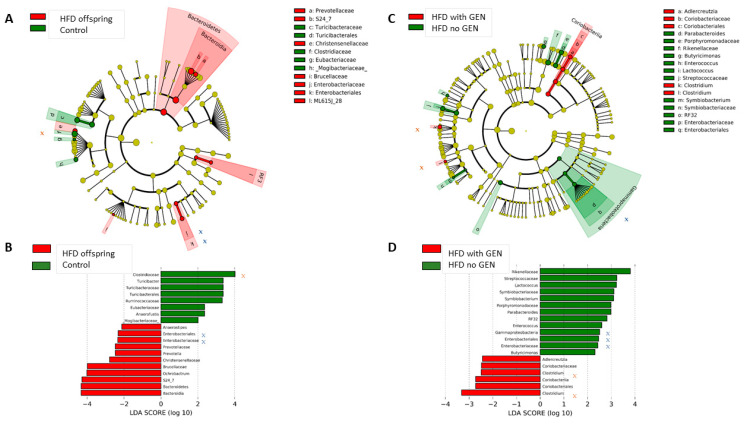
Figure 4.
Differences in the gut microbiota in the offspring of control and high-fat diet (HFD) fed dams. Circular cladograms (A,C) show results from linear discriminant analysis effect size (LEfSe), presenting the identified OTUs distributed according to phylogenetic characteristics around the circle. Differentially expressed taxa are highlighted by colored and shaded circles. Each circle’s diameter is relative to abundance of taxa in the community. Results between control versus HFD offspring shown in (A), and between HFD offspring supplemented with genistein (GEN) or not supplemented shown in (C). (B,D) LEfSe results showing which bacteria were significantly different in abundance between the control and HFD offspring (B), or between HFD offspring supplemented with GEN after tamoxifen versus not supplemented (D). Bacteria marked as x or x are those that were significantly different between control and HFD offspring, and reversed by GEN in HFD offspring.

