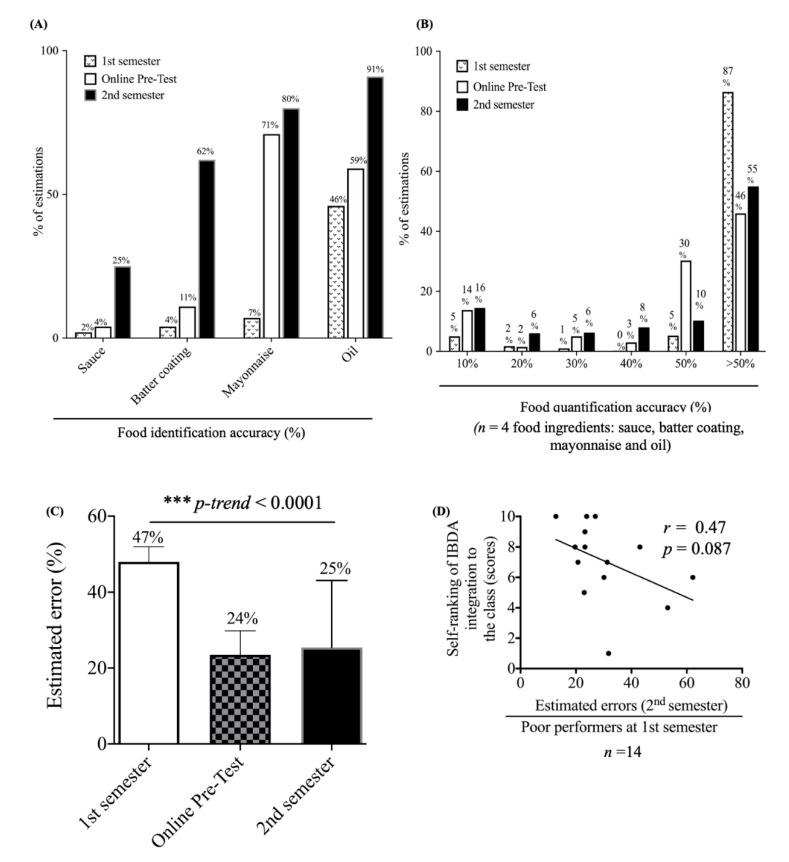
Figure 3.
Effects of repeated image-based dietary assessment (IBDA) training on the identification (A) and quantification (B) of condiments, cooking oils, and batter coatings, and poor performers (defined as ≥3 answers within >50% of the ground truth kcal on the first semester exam) (n = 14); linear trend test using the median value of each semester data; *** p-trend < 0.0001 (C). Spearman correlation analysis of self-ranking scores of usefulness of IBDA integration into the course and the median estimated error among poor performers (n = 14) (D).

