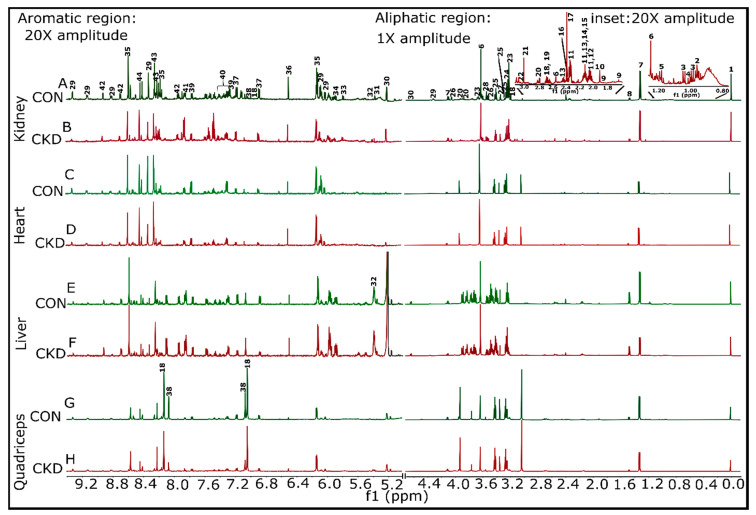
Figure 2.
Representative 1H NMR spectra for the aqueous phase samples from both control and CKD groups were shown for kidney, heart, liver, and quadriceps muscle. Samples having almost equal wet weigh for both control and CKD groups within a particular tissue sample were selected so that the comparisons become legitimate. (A,B) Kidney control#5 (12.3 mg) and CKD#5 (12.5 mg), respectively. (C,D) Heart control#5 (6.8 mg) and CKD#5 (6.8 mg), respectively. (E,F) Liver control#4 (13.2 mg) and CKD#4 (12.0 mg), respectively. (G,H) Quadriceps control#6 (14.7 mg) and CKD#6 (15.2 mg), respectively. (A) 1 represents the 4,4-dimethyl-4-silapentane-1-sulfonic acid (DSS peak), 2 is leucine, 3 is valine, 4 is isoleucine, 5 is ethanol, 6 is Ca2+-complexed ethylene diamine tetra acetic acid (EDTA), 7 is lactate, 8 is alanine, 9 is lysine, 10 is acetate, 11 is glutamate, 12 is proline, 13 is glutamine, 14 is methionine, 15 is O-acetyl choline, 16 is pyruvate, 17 is succinate, 18 is anserine, 19 is citrate, 20 is asparate, 21 is creatine, 22 is creatinine, 23 is Sn-glycero-3-phosphocholine, 24 is trimethyl-N-oxide, 25 is taurine, 26 is Myo-inositol, 27 is methanol, 28 is glycine, 29 is NAD+, 30 is glucose, 31 is allantoin, 32 is glucose-1-phosphate, 33 is uracil, 34 is uridine triphosphate, 35 is AMP + ATP, 36 is fumarate, 37 is tyrosine, 38 is histidine, 39 is tryptophan, 40 is phenylalanine, 41 is benzoate, 42 is nicotinurate, 43 is inosine/adenosine, and 44 is formate. Proton spectra were collected for both sets of samples (aqueous and organic phases) using a Bruker Avance Neo 14.1 T [600 MHz] (Bruker BioSpin Corporation, Billerica, MA, USA) equipped with a 1.7-mm TCl CryoProbe.

