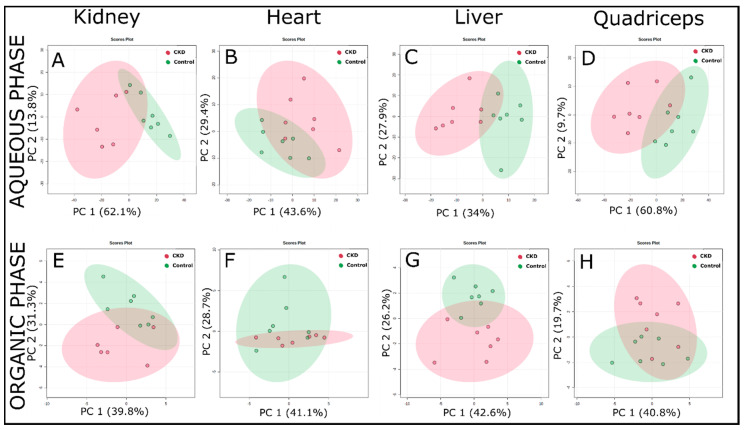
Figure 3.
Principal component analysis (PCA) analysis of the 1H-NMR spectra of the extracted tissue samples (using a targeted profiling approach) from control and adenine-induced CKD groups. (A–D) PCA score plots from the aqueous phase samples for the kidney, heart, liver, and quadriceps, respectively. (E–H) PCA score plots from the organic phase samples in the same order as mentioned above (n = 7/group).

