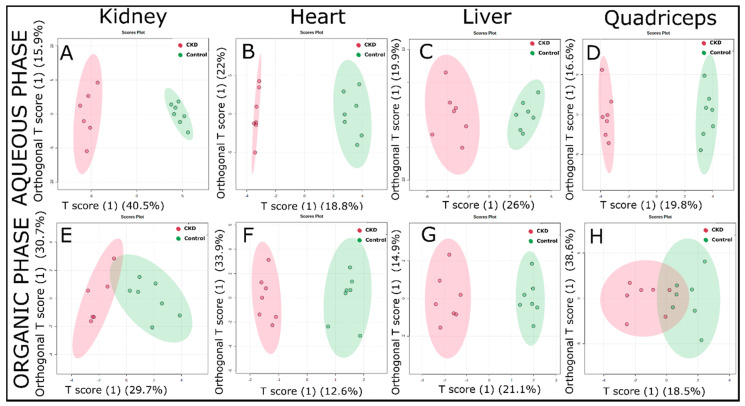
Figure 4.
Orthogonal projections to latent structures discriminant analysis (OPLS-DA) score plots obtained from the 1H-NMR spectra of the extracted tissue samples (using the targeted profiling approach) from the control and adenine-induced CKD groups. (A–D) The OPLS-DA score plots from the aqueous phase samples for the kidney, heart, liver, and quadriceps, respectively. (E–H) The OPLS-DA score plots from the organic phase samples (n = 7/group).

