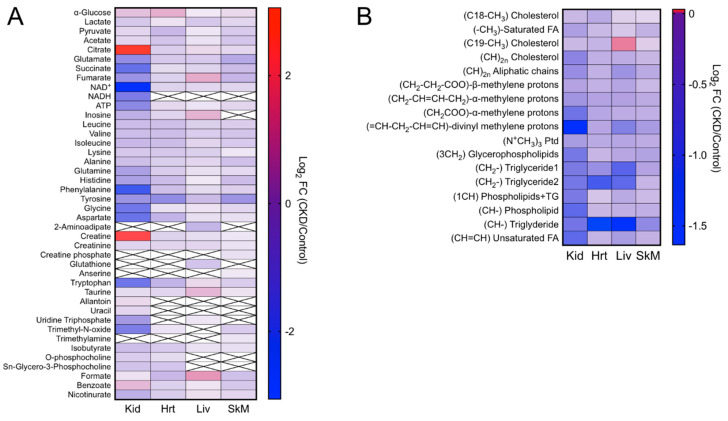
Figure 5.
Heatmap representing the log2-transformed fold changes (CKD/control) of the metabolites measured in the (A) aqueous phase and (B) organic phase. Boxes with an “x” inside indicate that the specified metabolite was not detected in the respective tissue (n = 7/group). FC: fold change, Kid: kidney, Hrt: heart, Liv: liver, and SkM: skeletal muscle.

