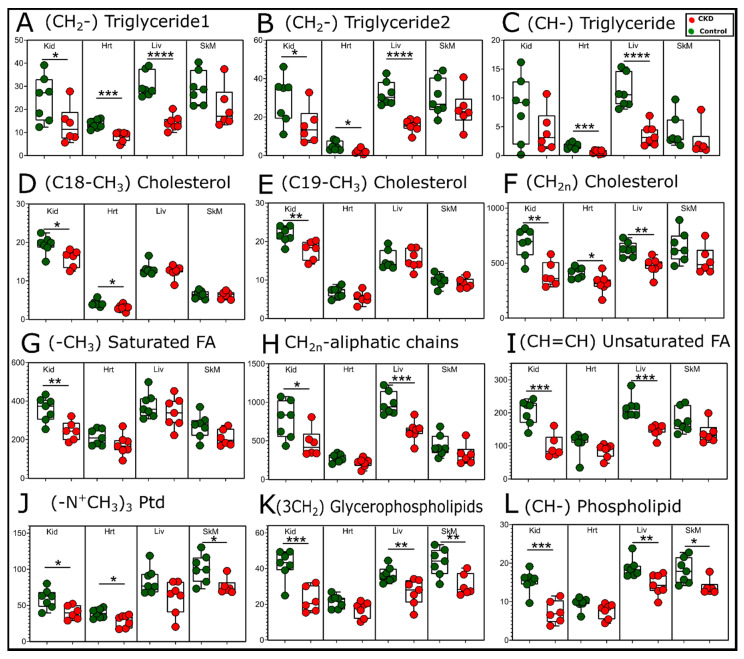
Figure 8.
Changes in the lipid compounds with CKD. Quantification of the relative peak areas of selected lipid compounds obtained from organic phase samples presented as Box and Whisker plots (showing 95% confidence intervals). A two-tailed unpaired Student’s t-test was performed to determine the statistical significance, with * p < 0.05, ** p < 0.01, *** p < 0.001, and **** p < 0.0001 (n = 7/group/tissue). Abbreviations: Kid = kidney, Hrt = heart, Liv = liver, and SkM = skeletal muscle.

