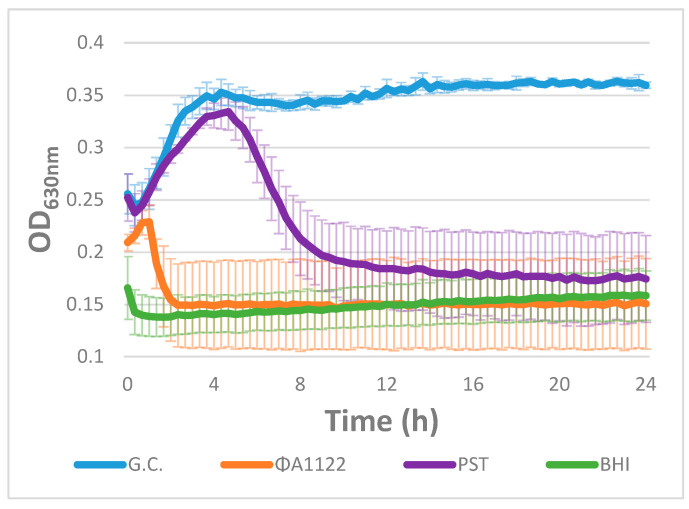
Figure 1.
Lysis curve of EV76 cultures infected by phages. A Y. pestis EV76 bacterial suspension (90 µL of 108 CFU/mL) divided in a 96-well microplate was infected with two different Y. pestis-specific phages (ϕA1122 and PST; 10 µL of 107 PFU/mL) at an MOI of 0.01 (time 0 is time of infection). Growth/lysis curves were assessed by tracking the OD630nm at 37 °C for 24 h in 15-min intervals using a Spark 10 M plate reader. The results are representative of one of three independent biological replicates. Values are the average of four replicate wells in the same experiment, and the error bars represent the standard deviation (STDEV). G.C. = Growth Control.

