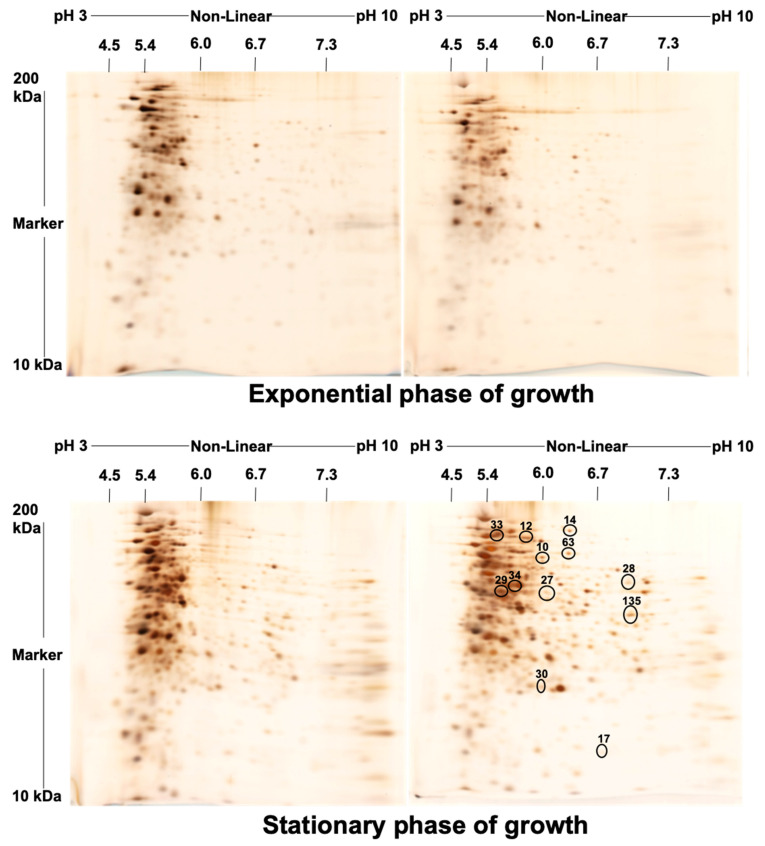
Figure 2.
Duplicate sets of two-dimensional gel electrophoresis using immobilized pH gradient strips. pH 3–10 NL for proteins extracted from the exponential and the stationary growth phases of MAH 104. The horizontal axis represents the isoelectric point (pI) ranging between 3–10 and the vertical axis represents the second-dimension electrophoresis by molecular weight. Gels were silver-stained. The 12 significantly differentially expressed spots (≥2-fold change) between the exponential and the stationary growth phases that applied to nLC-MS/MS analysis were marked by circles.

