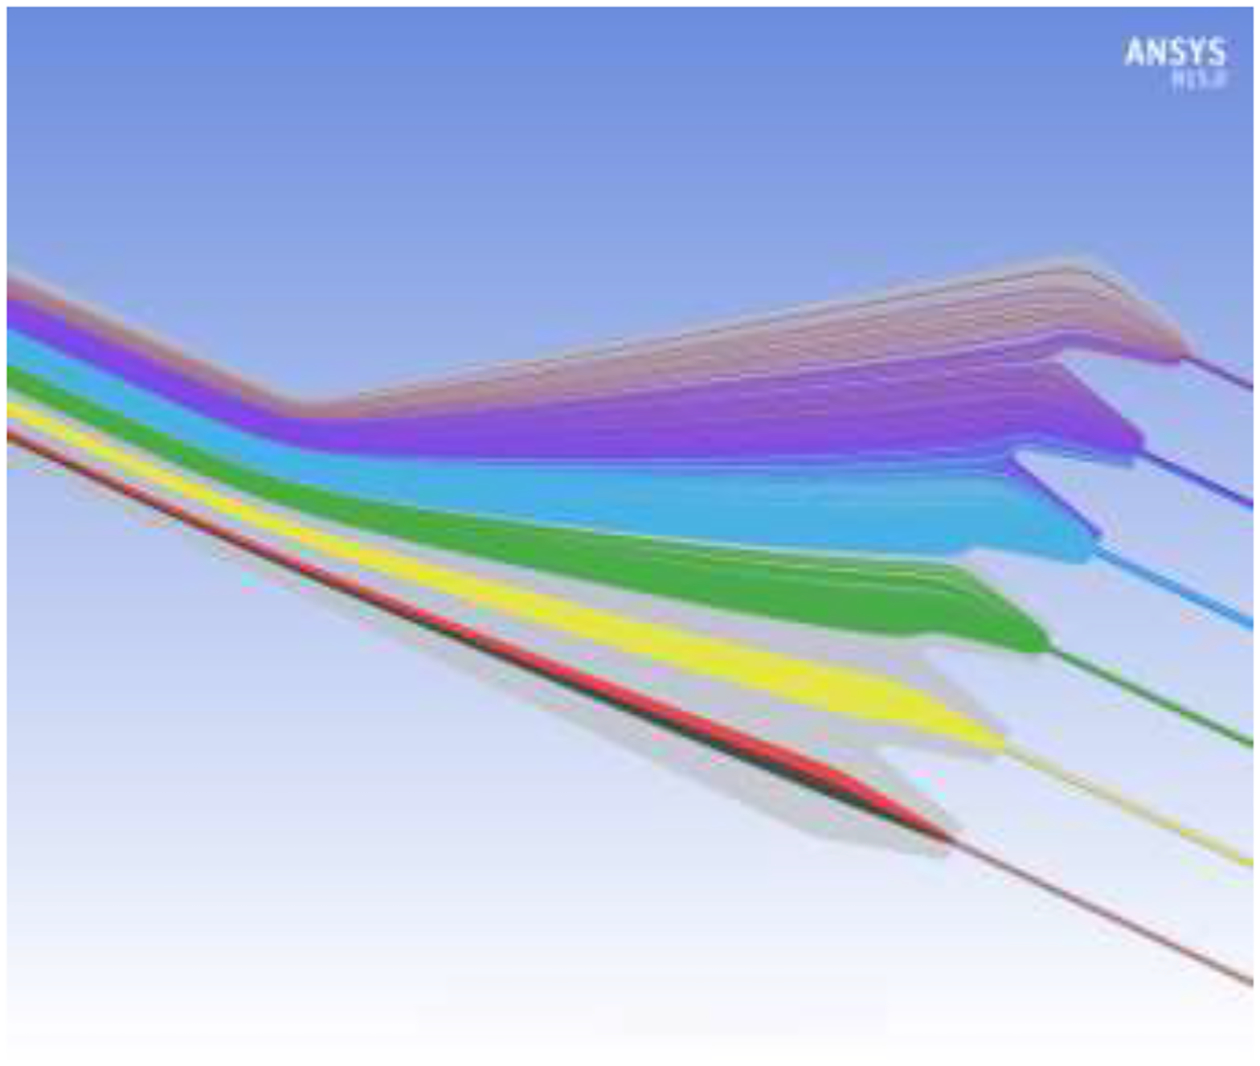
Fig. 7.

Simulation of separation of different immunomagnetically labeled cell populations having different antigen expression levels and, consequently, different magnetophoretic mobilities. The different color cell tracks correspond to different magnetophoretic mobilities as described in the text.
