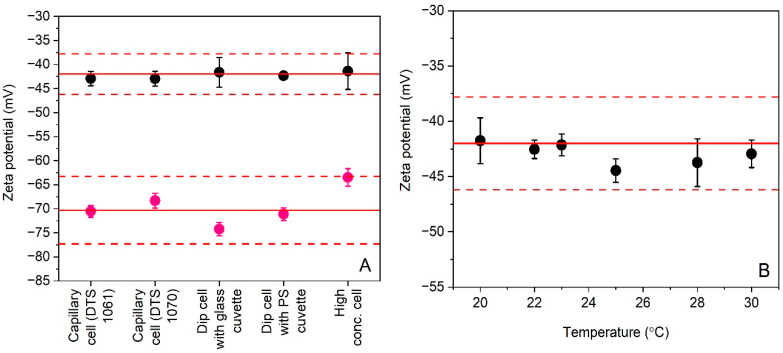
Figure 1.
Average zeta potential results (nr = 4) for polystyrene particles DTS 1235 (black circles) and PS-A (purple circles) obtained by ELS during precision studies when using different types of measurement cells (A) and different measurement temperatures (B). Error bars correspond to standard deviations. Solid and dashed lines reflect the zeta potential reference values and uncertainties assigned to the materials by the manufacturers.

