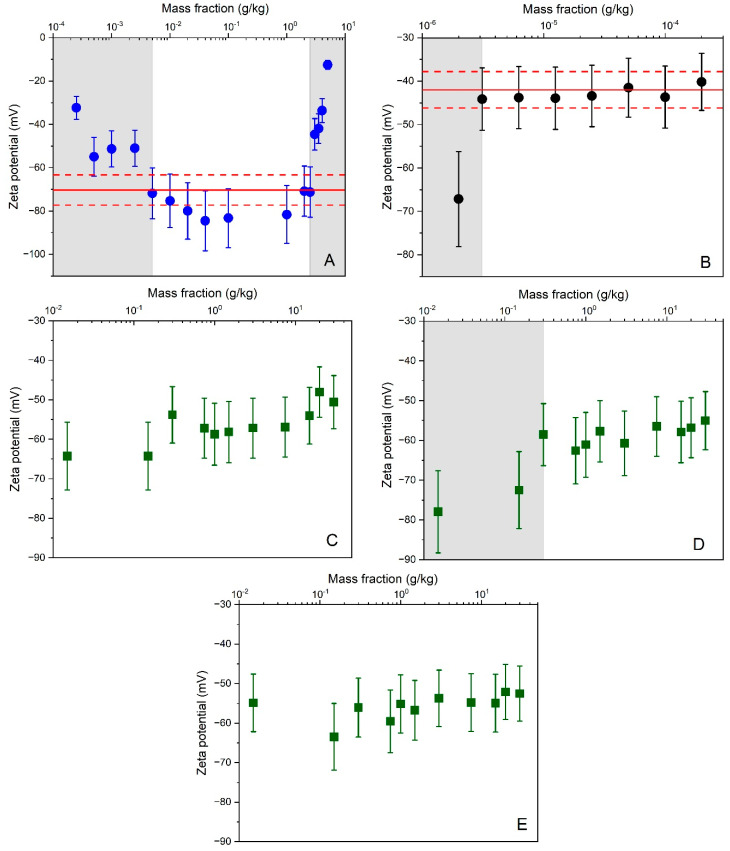
Figure 2.
Average zeta potential results as a function of particle mass fractions obtained by ELS for different materials and cells: (A) PS-B + capillary cell DTS 1061 with 4 mm OP; (B) DTS 1235 + capillary cell DTS 1061 with 4 mm OP; (C) AWP4-B + capillary cell DTS 1070 with 4 mm OP; (D) AWP4-B + dip cell with PS cuvette with 10 mm OP; (E) AWP4-B + high concentration cell with 2 mm OP. Error bars correspond to expanded (k = 2) measurement uncertainties. Solid and dashed lines reflect the zeta potential reference values and uncertainties assigned to the materials by the manufacturers. Results located in gray shaded areas were identified as outside the working range.

