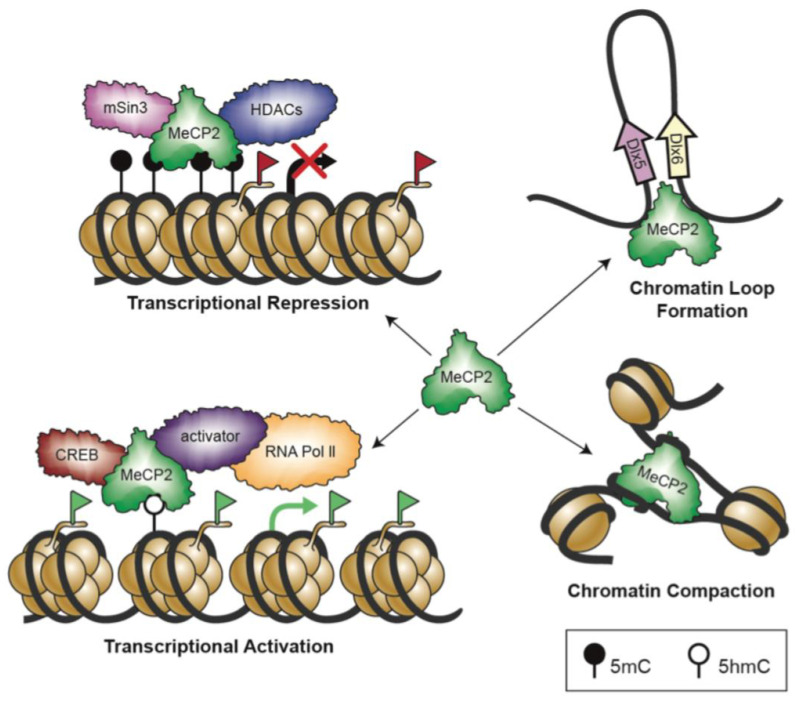
Figure 2.
Schematic representation of different MeCP2 functions in brain cells: this simple hypothetical cartoon illustrates some of the conceptual functional properties of MeCP2, through which it controls gene regulation. Figure is adapted and modified from Zachariah and Rastegar [127]. Red and green flags refer to inactive and active histone marks, respectively.

