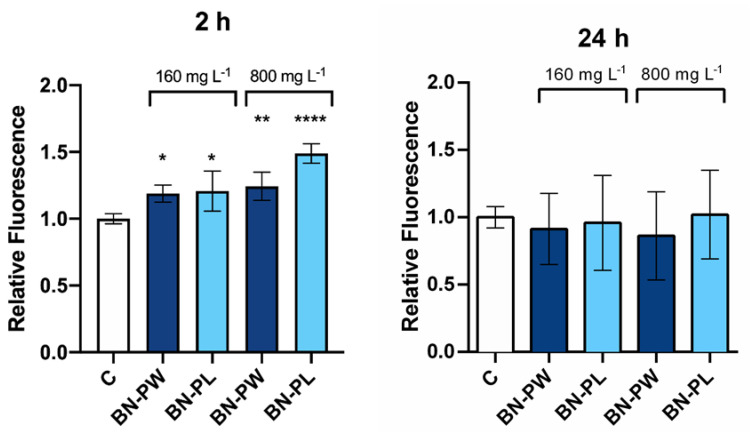
Figure 9.
Oxidative stress determination of S. cerevisiae cells exposed to 160 and 800 mg/L of BN-PW and BN-PL during 2 and 24 h. The reported values are expressed in arbitrary units and correspond to the averages of two independent experiments (±standard deviation, SD), employing three technical replicates per exposure condition tested in each case. Differences were established using a one-way ANOVA followed by the Dunnett post hoc test to compare every mean with the control, and considered significant at p ≤ 0.05. * p ≤ 0.05, ** p ≤ 0.01, **** p ≤ 0.0001. The figure including the positive control condition (H2O2 (10 mM)) is available as Supplementary Material (Figure S3).

