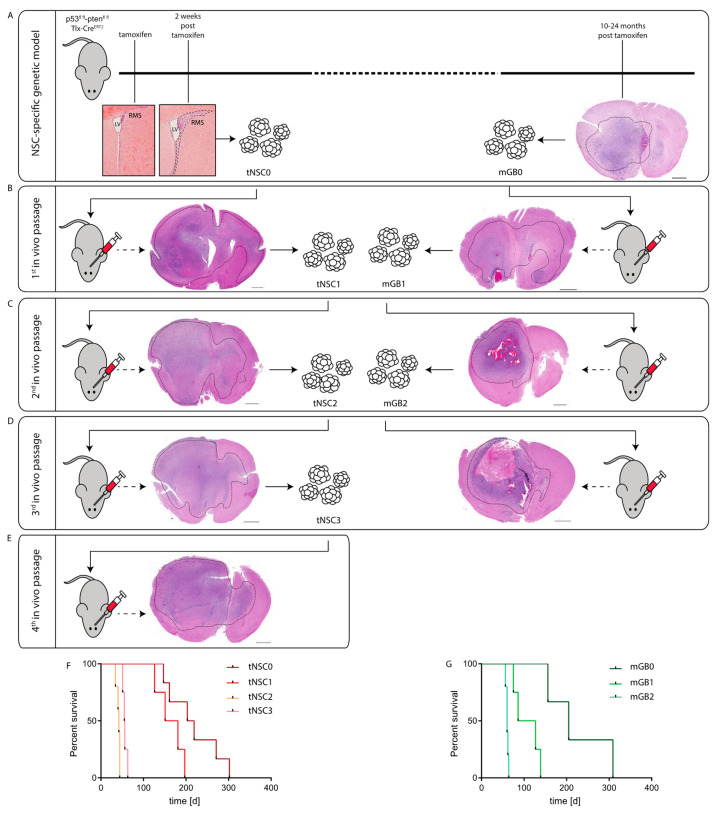
Figure 1.
Generation of syngeneic glioma cell lines through in-vivo passaging of Pten/p53-deleted cells isolated from a genetic glioma model. (A) Schematic representation of the Pten/p53 genetic glioma model from which NSCs have been isolated either at early pre-malignant stage (left panel) or from a full-blown tumor (right panel). Scale bar = 1000 µm. Left panel: lateral ventricle (LV) with rostral migratory stream (RMS) at time of tamoxifen injection and at 2 weeks after tamoxifen-induced Pten/p53 recombination. Sections were stained with hematoxylin and eosin (H&E). Right panel: section of a full-blown tumor developed 18 months after tamoxifen-induced Pten/p53 deletion. Section was stained with hematoxylin and eosin (H&E). Scale bar = 1000 µm Dotted line shows tumor area. (B) First in vivo passage of tNSC0 (left panel) and mGB0 (right panel). Representative picture of a tNSC0-derived (left panel) and mGB0-derived (right panel) glioma. Sections were stained with hematoxylin and eosin (H&E). Scale bars = 1000 µm, (C) second in vivo passage of tNSC1 (left panel) and mGB1 (right panel). Representative picture of a tNSC1-derived (left panel) and mGB1-derived (right panel) glioma. Sections were stained with hematoxylin and eosin (H&E). Scale bars = 1000 µm. (D) Third in vivo passage of tNSC2 (left panel) and mGB2 (right panel). Representative picture of a tNSC2-derived (left panel) and mGB2-derived (right panel) glioma. Sections were stained with hematoxylin and eosin (H&E). Scale bar = 1000 µm, (E) fourth in vivo passage of tNSC3 (left panel). Representative picture of a tNSC3-derived (left panel). Sections were stained with hematoxylin and eosin (H&E). Scale bar = 1000 µm. (F) Kaplan–Meier survival curve of mice transplanted with tNSC0, tNSC1, tNSC2, and tNSC3 glioma cell lines. Time = days. tNSC0 (n = 7), tNSC1 (n = 6), tNSC2 (n = 6), tNSC3 (n = 7). (G) Kaplan–Meier survival curve of mice transplanted with mGB0, mGB1, and mGB2 glioma cell lines. Time = days. mGB0 (n = 6), mGB1 (n = 6), mGB2 (n = 6).

