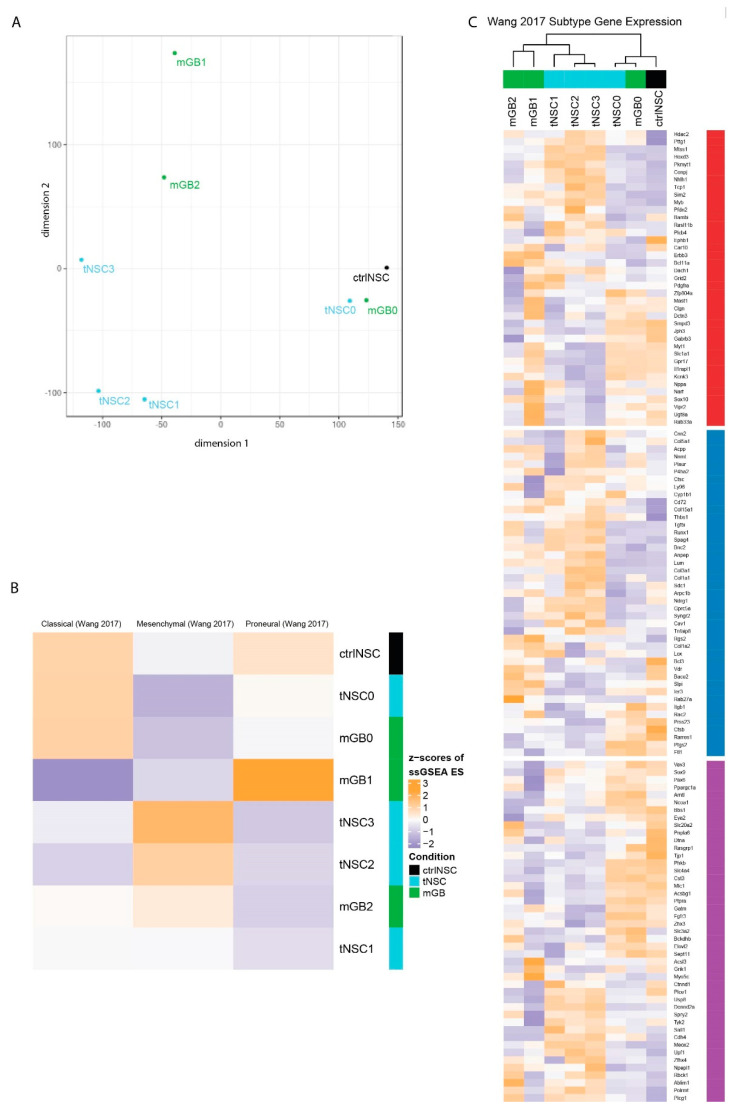
Figure 2.
Transcriptomic characterization of the new glioma cell lines finds distinct expression profiles that correspond to known human glioblastoma subtypes. (A) Multidimensional scaling (MDS) analysis of whole transcriptomes from the newly generated glioma cell lines (tNSC0-3, mGB0-2) and of non-transformed NSCs (ctrlNSCs). (B) Heatmap showing z-scores of ssGSEA enrichment scores of the murine glioma cell lines for published glioblastoma subtype gene expression signatures. (C) Heatmap of z-scores of expression of glioblastoma subtype genes, as defined in Wang et al. Genes are labeled with their subtype. The gene expression of cell lines with sample replicates (tNSC4 and ctrlNSC: both n = 3) was averaged.

