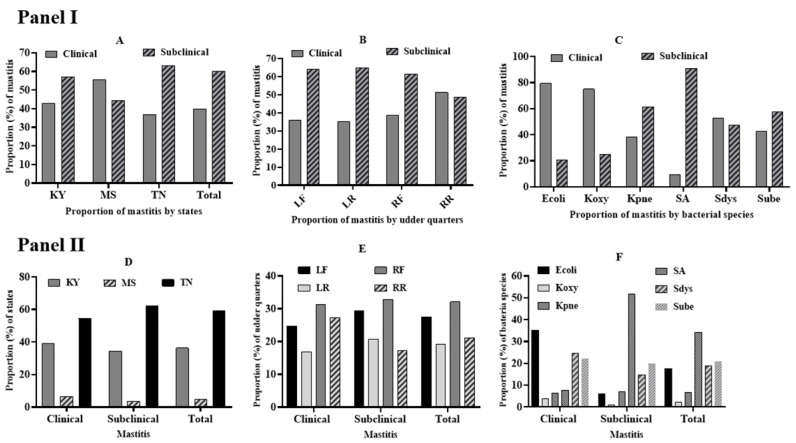
Figure 1.
The distribution in the percentage of clinical and subclinical bovine mastitis within (Panel I) and among (panel II) three states, udder quarters with etiological bacterial species. Panel I showed the distribution of clinical and subclinical mastitis within three states, udder quarters, and etiological bacterial species. Panel I, (A) distribution of clinical and subclinical mastitis within each state, Panel I, (B) distribution of clinical and subclinical mastitis within each quarter, Panel I, (C) distribution of clinical and subclinical mastitis caused by each bacterial species, Panel II showed the distribution of clinical and subclinical bovine mastitis among three states, four udder quarters, and six etiological bacterial species. Panel II, (D) distribution of clinical and subclinical mastitis among three US states, Panel II, (E) distribution of clinical and subclinical mastitis among four udder quarters, Panel II, (F) distribution of clinical and subclinical mastitis among six bacterial species, Ky: Kentucky, MS: Mississippi, TN: Tennessee, LF: Left front, LR: Left rear, RF: Right front, RR: Right rear, Ecoli: E. coli, Koxy: K. oxytoca, Kpne: K. pneumoniae, SA: Staph. aureus, Sdys: Strep. dysgalactiae, Sube: Strep. uberis.

