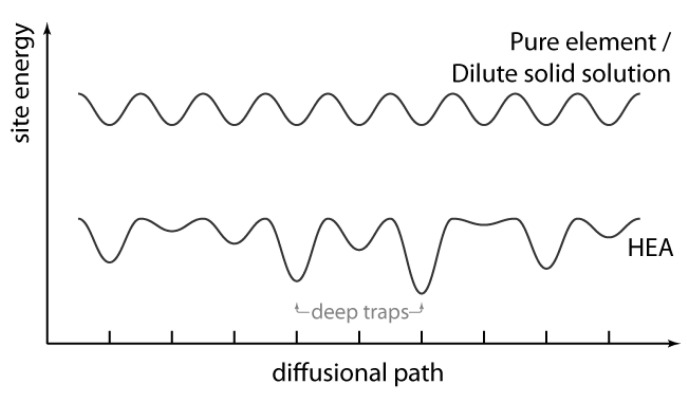
Figure 4.
Schematic representation of the proposed difference in lattice potential energy profile along an atomic diffusion path in a pure element or dilute solid solution (top) and an high-entropy alloy (HEA) lattice (bottom). Note it is assumed that the distance between atomic sites is constant. Reproduced from Reference [108]. A similar schematic for the HEA energy profile was given in Reference [105].

