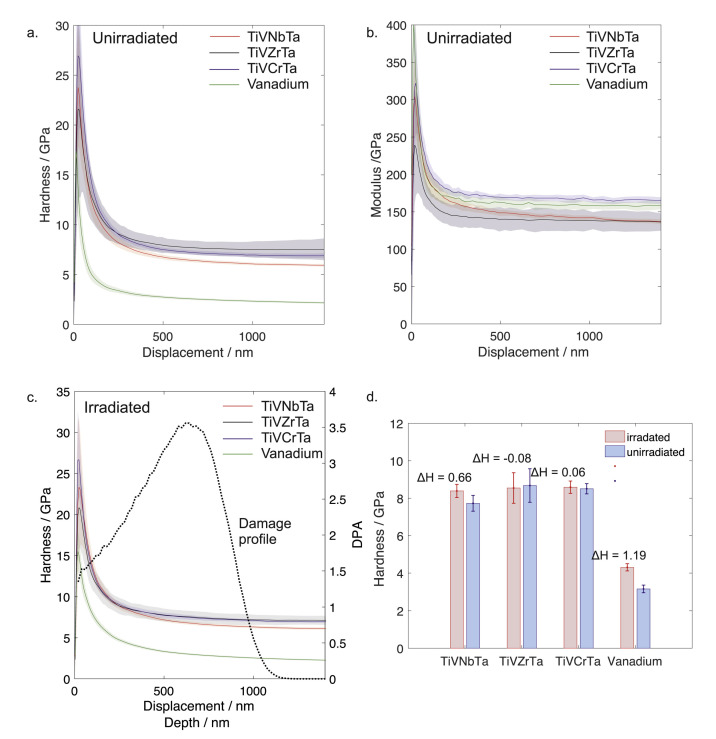
Figure 5.
Indentation hardness and irradiation hardening plots (a) unirradiated indentation hardness vs. depth (b) Unirradiated indentation modulus vs. depth (c) Irradiated indentation hardness vs. depth. The irradiation damage profile is given by the dashed line. (d) Indentation hardness of irradiated and unirradiated HEAs and control sample at 300 nm indentation depth. Shaded area in (a–c) and error bars in (d) represent the standard deviation of 25 indentations. Reproduced from Reference [20].

