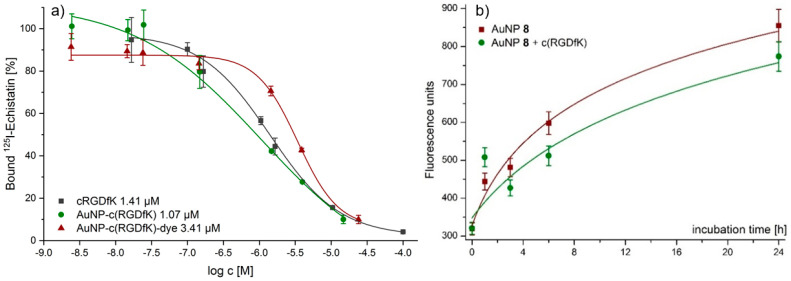
Figure 2.
(a) Three representative IC50-curves from single competitive binding experiments. Shown is one curve with single IC50 value out of three values from three different experiments. (b) Cell uptake studies of AuNPs 8 in A431 cells at different time points obtained without blocking (red) and with a 10-fold excess of c(RGDfK) (green).

