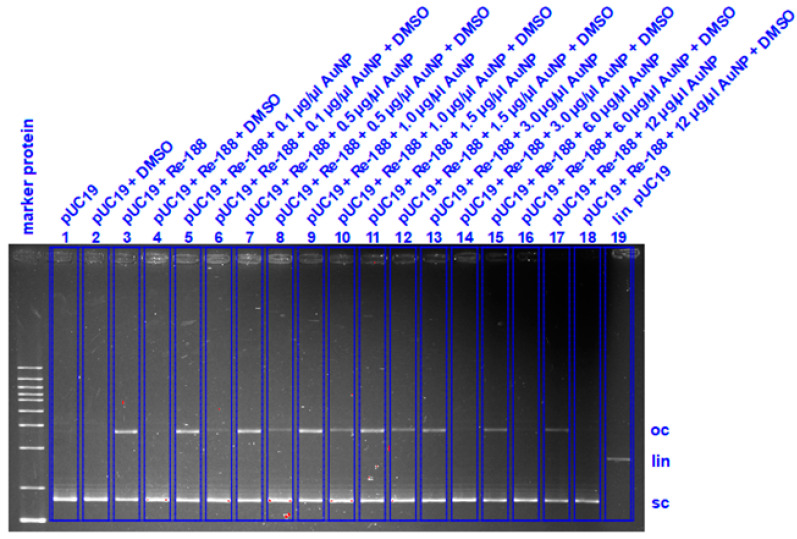
Figure A18.
Evaluation of the irradiation experiments using Re-188 in combination with AuNPs 1 via gel electrophoresis. Left line is the marker protein. The lowest bands show intact sc-DNA, middle bands show lin-DNA with DSBs, and the highest band show oc-DNA with SSBs. The direction of elution is from top to bottom.

