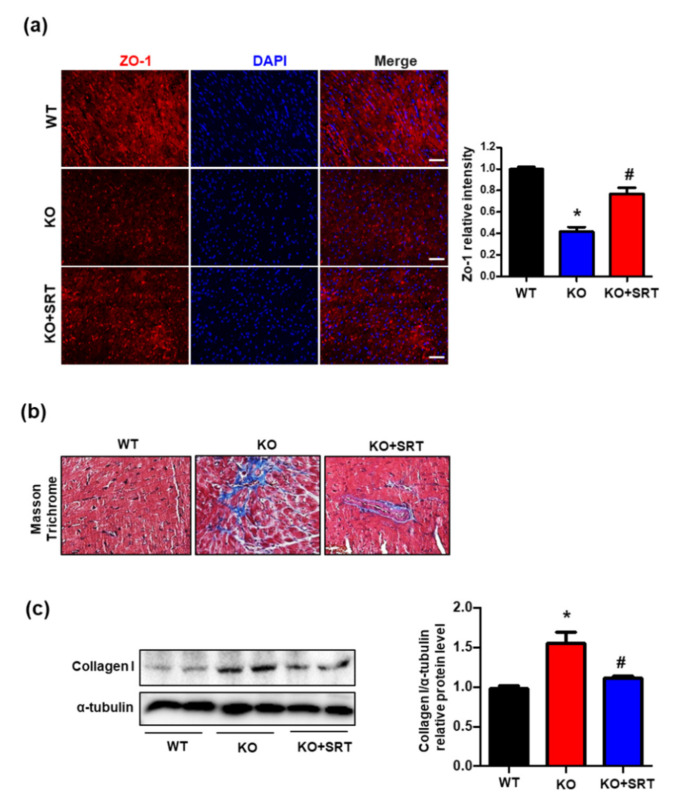
Figure 6.
SIRT1 activation upregulates the expression of ZO-1 and collagen I. (a) Representative immunofluorescent staining images of ZO-1 (red) and nuclei (blue) of mouse hearts. Quantified ZO-1 expression was normalized to the WT group (Scale bars, 200 µm). (b) Representative Masson’s trichrome staining of high-magnification sections of the hearts of mice. (c) Cardiac collagen I protein expression were determined by Western blotting. α-tubulin was used as the internal control. Densitometric analysis of collagen I protein level is shown. The data are presented as means ± SEM of at least three independent experiments. (n = 5 mice in each group; * p < 0.05 vs. WT mice. # p < 0.05 vs. CRIF1 EKO mice).

