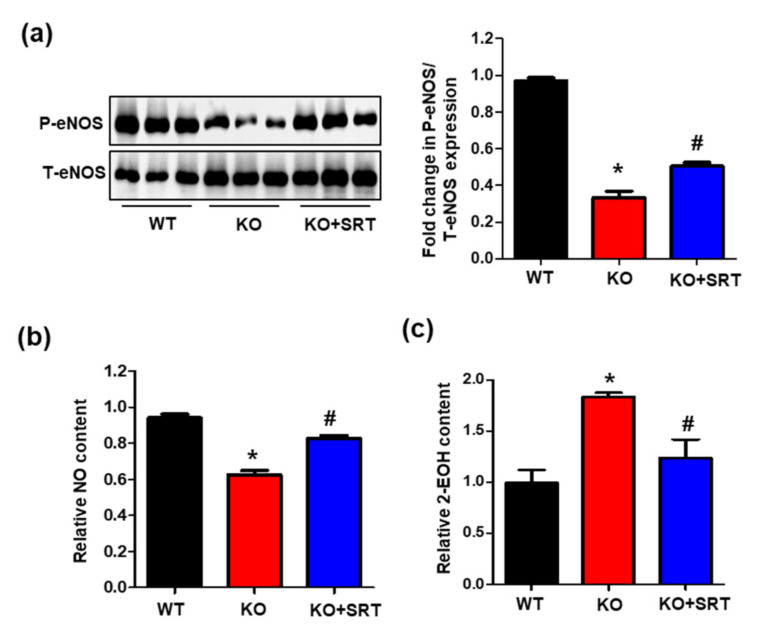
Figure 7.
SIRT1 activation mediates eNOS/NO activation and ROS levels. (a) Western blot analysis for phosphorylation at serine 1117 of eNOS, total eNOS, and α-tubulin in the heart tissues of mice. The protein expression levels were quantified by densitometric analysis (right). (b) Serum levels of nitrite and nitrate levels were examined in mice. (c) Relative 2-EOH fluorescence intensity measured the heart tissues of mice. The data are presented as means ± SEM of at least three independent experiments (n = 5 mice in each group; * p < 0.05 vs. WT mice. # p < 0.05 vs. CRIF1 EKO mice).

