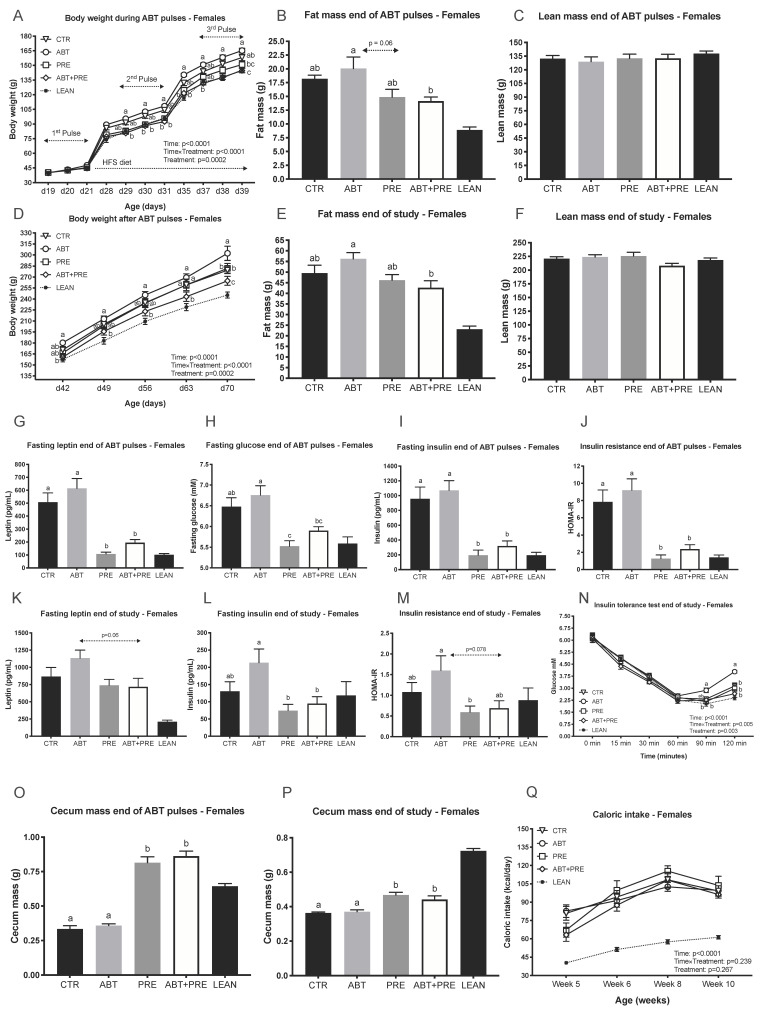
Figure 2.
Pulsed early life antibiotic exposure and weaning onto a high fat/sucrose diet increases body weight and insulin levels/resistance in females, all reversible with prebiotic co-administration. (A) Body weight of females during antibiotic pulses (n = 9 rats/group). (B) Fat mass and (C) Lean mass of females at the end of antibiotic pulses (n = 7–10 rats/group). (D) Body weight of females after antibiotic pulses (n = 9 rats/group). (E) Fat mass and (F) Lean mass of females at the end of the study (n = 8–10 rats/group). Portal vein leptin (G) and insulin (I) levels of females measured at the end of antibiotic pulses (n = 8–10 rats/group). (H) Fasting glucose of females measured at the end of antibiotic pulses via tail bleed (n = 8–9 rats/group). (J) Insulin resistance of females was calculated at the end of antibiotic pulses (n = 8–10 rats/group). Portal vein leptin (K) and insulin (L) levels of females measured at the end of the study (n = 7–9 rats/group). (M) Insulin resistance of females was calculated end of study (n = 8–10 rats/group). (N) Glucose response to insulin in females measured by ITT at the end of the study (n = 7–10 rats/group). (O,P) Cecum mass in females at the end of antibiotic pulses (O) and end of study (P) (n = 8–10 rats/group). (Q) Average caloric intake (kilocalories) of females calculated as the average of energy intake over 4 days measured at 4 different weeks of life (n = 6–8 rats/group). Results are shown as mean ± SEM. The superscripts a,b indicate significant differences between groups where labelled means without a common superscript letter differ, p < 0.05 (i.e., ‘a’ and ‘b’ differ; ‘ab’ does not differ from ‘a’ or ‘b’). CTR, control; ATB, antibiotic; PRE, prebiotic; ATB + PRE, antibiotic + prebiotic; LEAN, lean control; d, day of life.

