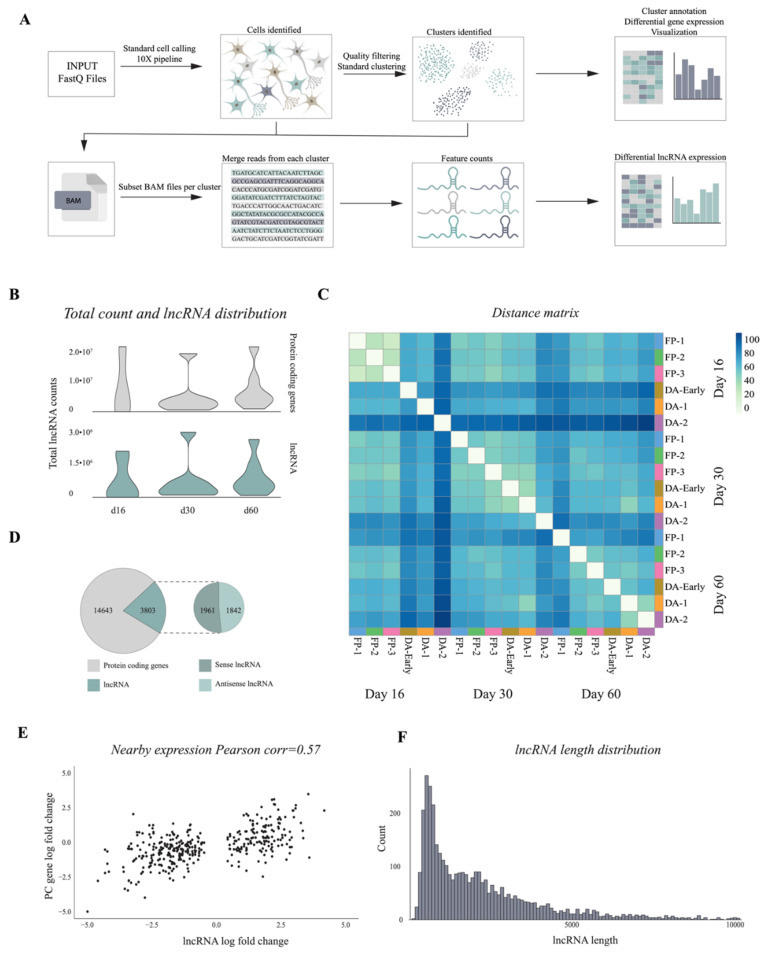
Figure 5.
Bioinformatic pipeline detects lncRNAs from 10x Genomics single cell dataset (A) Schematic overview of pipeline designed for lncRNA quantification. (B) Count distribution of protein-coding genes and lncRNAs from each sample at three time points of hPSC DA neuron differentiation (day 16, 30, 60). (C) Heatmap of Euclidean distance across different cell types and time points (log2 normalized counts). (D) Number and distribution of protein-coding genes and lncRNAs expressed (baseMean >1), strand (sense “+”, antisense “−”). (E) Pearson correlation of change in expression of protein-coding genes and lncRNAs (±5Kb, p adj < 0.01). The x-axis shows the log fold change of the lncRNA and the y-axis the log fold change of the overlapping protein-coding gene. (F) Length distribution of expressed lncRNAs (x-axis).

