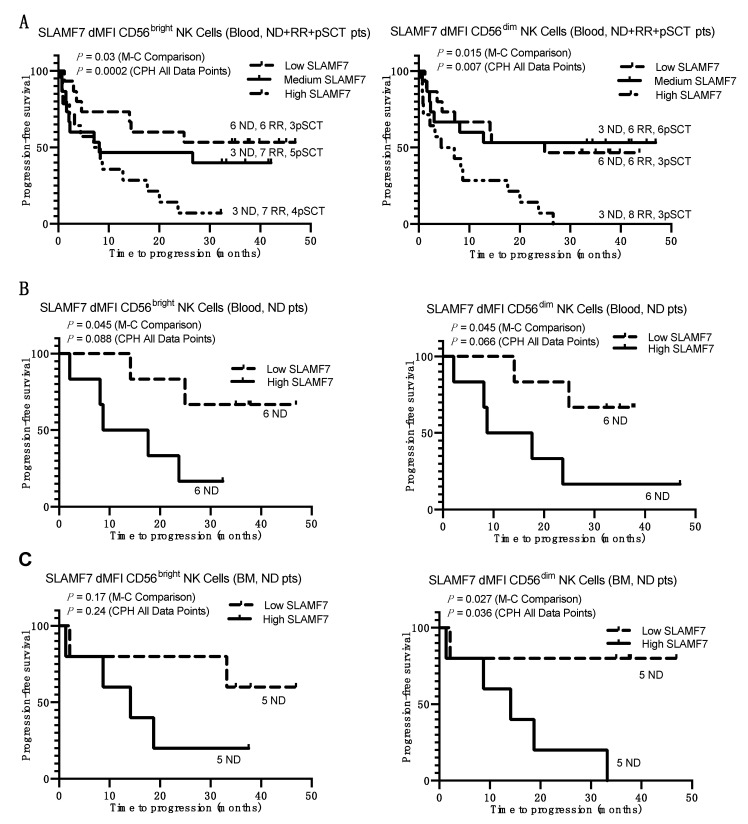
Figure 4.
Kaplan–Meier survival plots showing time to progression as a function of SLAMF7 expression on NK cells in blood and BM. (A) Plots for the combined ND+ RR+ pSCT MM patients divided into tertiles based on their dMFI values for SLAMF7 expression on CD56bright (left) and CD56dim NK cells (right) in blood. Numbers of patients in each tertile that are ND, RR, or pSCT are indicated adjacent to each plotted line. (B,C) Plots for only ND MM patients divided into halves above and below the median of dMFI values for SLAMF7 expression on their CD56bright (left) and CD56dim NK cells (right) in peripheral blood (B) and BM (C). Line designations for high-, medium-, and low-expression tertiles and halves are indicated in the individual panels. p values are listed for a Cox proportional hazards (CPH) test performed on all data points and Mantel–Cox (M–C) statistical analysis of each patient group divided into tertiles or halves.

