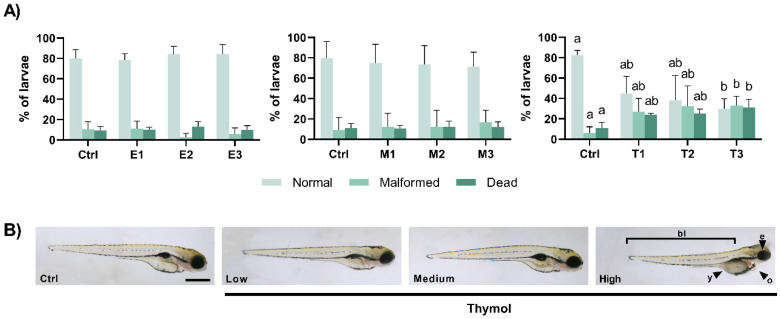
Figure 2.
(A) Percentages of normal, malformed and dead eleutheroembryo at the end of the exposure period (at 98 hpf). Values are presented as mean ± SD of five replicates per treatment (n = 10 random embryos per replicate). Different lowercase letters represent statistical differences among treatment groups (one-way ANOVA, p < 0.05). (B) Representative views of the malformations observed in eleutheroembryo exposed to Thymol. Malformations were observed after exposure to the highest concentration of Thymol (T3) namely as abnormal eye (e), yolk (y), and pericardiac oedema (o) and by the decreased body length (bl). The scale bar represents 500 μm.

