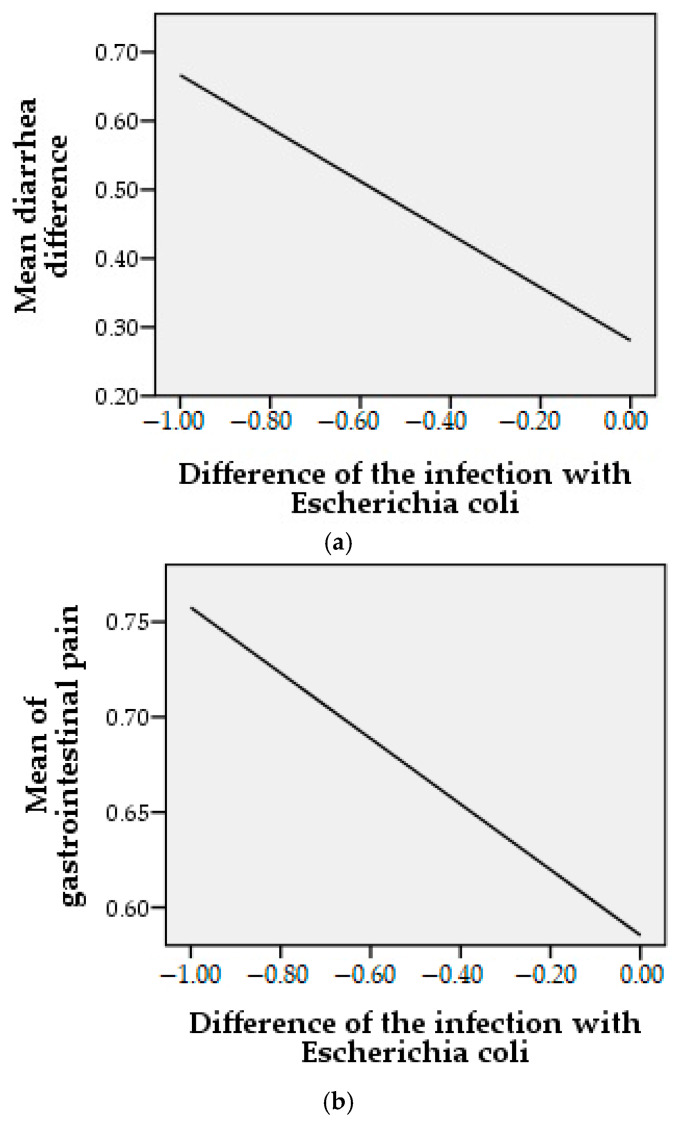
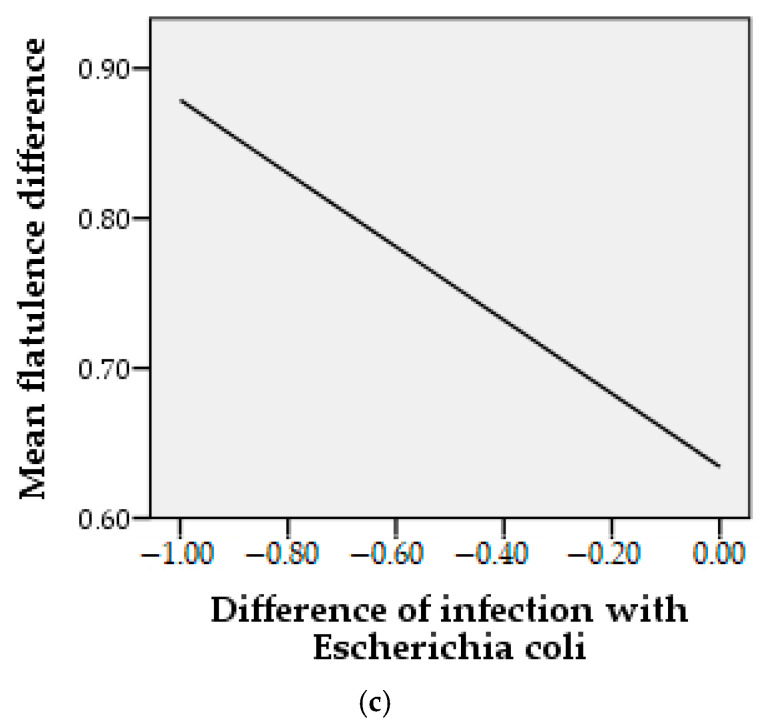
Figure 5.
Correlation between the incidence of gastrointestinal symptoms and Escherichia coli infection at the end of the treatment period where “1” are noted as the presence and “0” are noted as absence of conditions.; (a) = mean difference diarrhea, (b) = mean difference gastrointestinal pain, (c) = mean difference flatulence.


