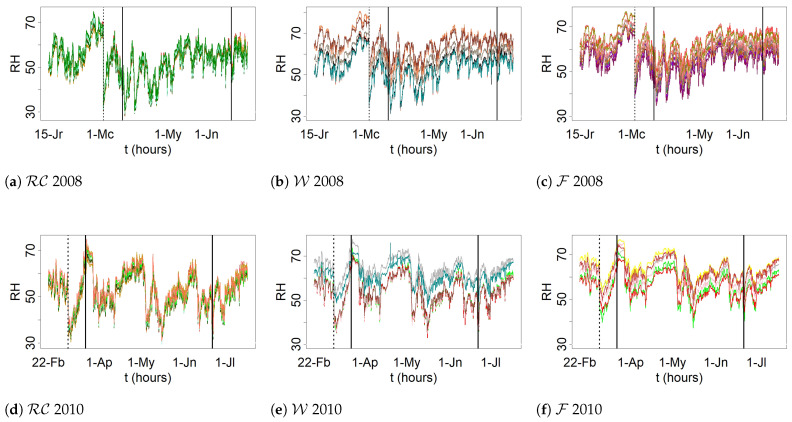
Figure 2.
Evolution of . Trajectories of sensors located at equivalent positions in the apse vault are depicted in the same chart (data recorded between 15 January and 4 July 2008): cornice and ribs () (a), walls () (b), and frescoes () (c). Likewise for data collected between 22 February and 18 July 2010: (d), (e), and (f). Separation by seasons (Wr, Sp and Sm) is indicated by means of vertical solid lines. Wr is divided into two periods (dashed line) because a structural break was identified according to the supF and CUSUM tests.

