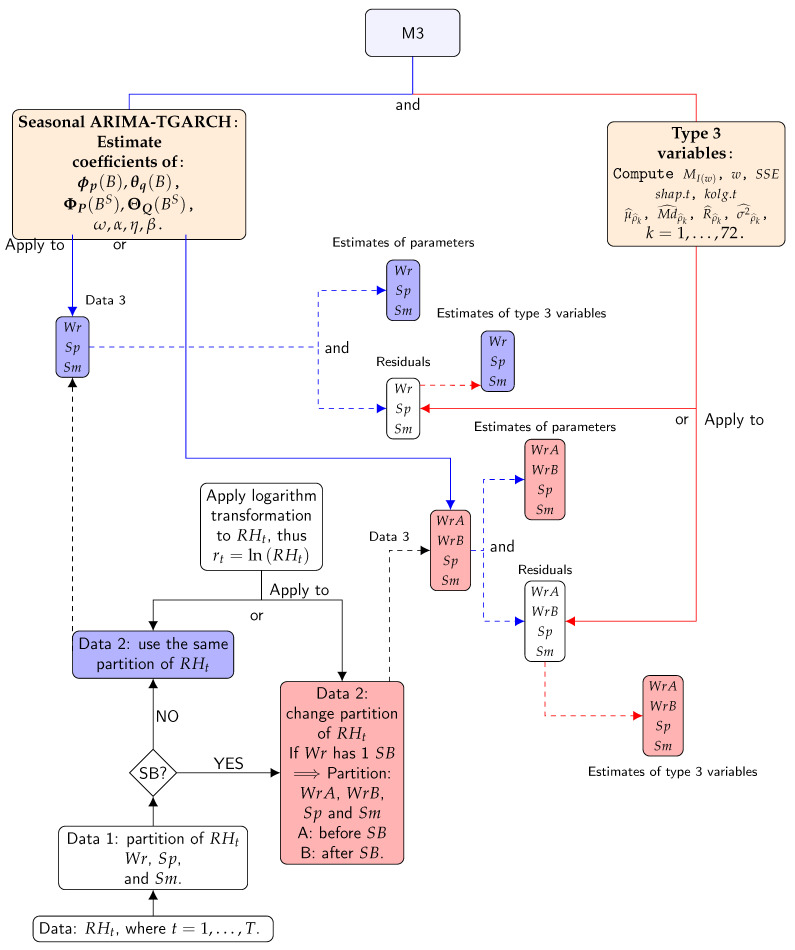
Figure 6.
Flow chart for the steps of method 3: Blue lines indicate estimated parameters. Red lines indicate type 3 variables. Solid lines indicate processes. Dashed lines indicate results. The first step divides the different time series according to the climatic conditions (Wr, Sp, and Sm) (Data 1). The second step organises the time series according to possible structural breaks (SBs) (Data 2). The third step applies logarithmic transformation to Data 2, the result is Data. The fourth step applies the model to Data 3 in order to obtain the estimates of model parameters (first result) and then the residuals from the method. The fifth step consists of applying the formulas of type 3 variables to the residuals (second result). Different boxes display symbols Wr, Sp, and Sm (or WrA, WrB, Sp, and Sm). This indicates that the results correspond to all different parts of the time series.

