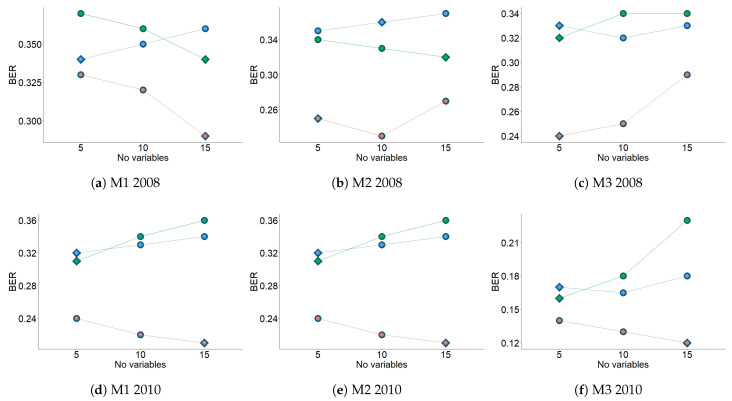
Figure 8.
BER according to the number of variables (5, 10 or 15) and different number of components (1: orange dots, 2: blue dots, or 3: green dots) for each method, for 2008 and 2010. Three-fold CV was run 1000 times using centroid distance prediction. Diamonds indicate the optimal number of variables per component according to the lowest value of BER.

