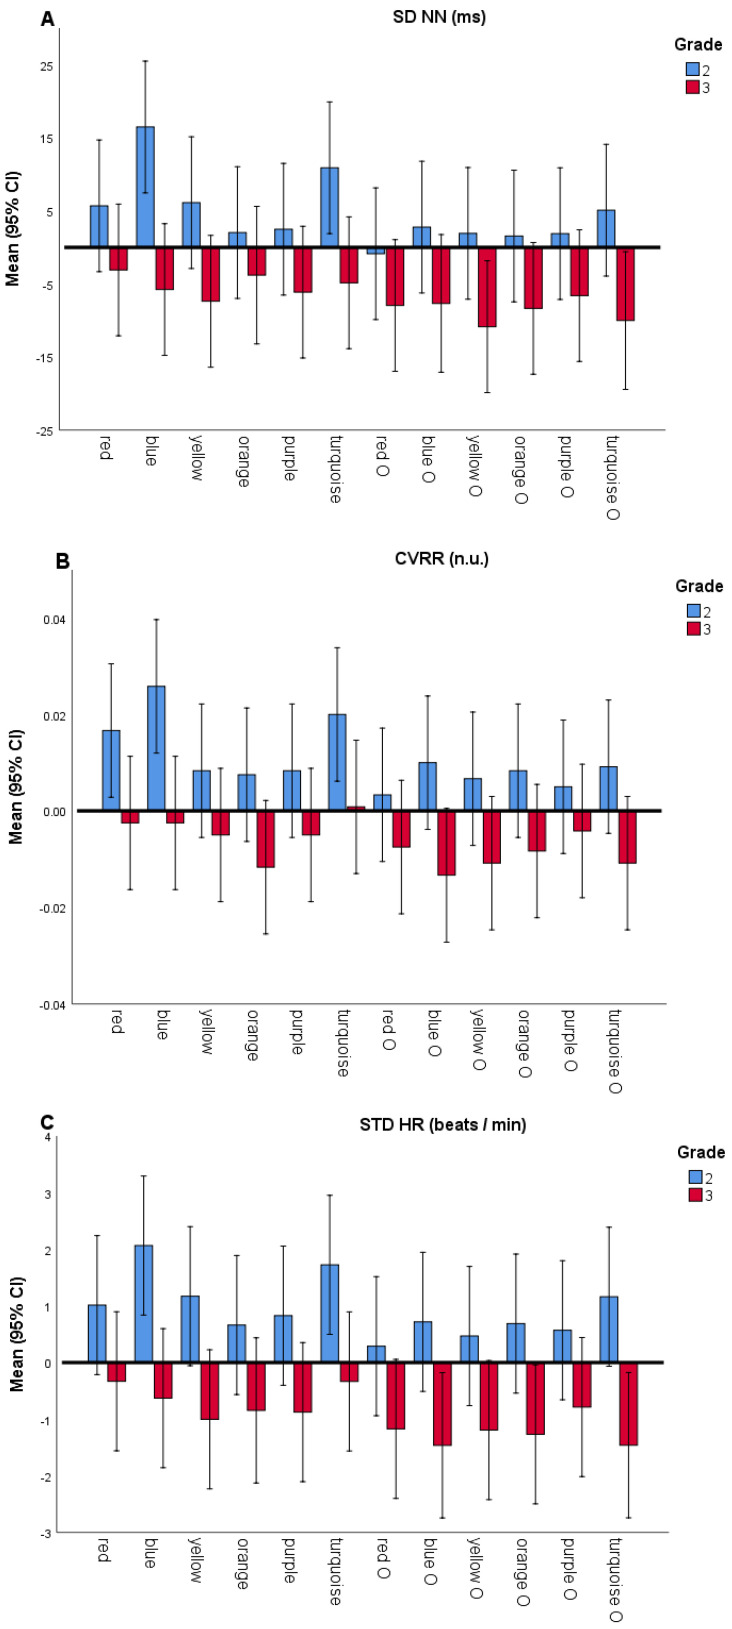
Figure 2.
SDNN, CVRR and STD HR by grade and color (normalized on white color). (A) Normalized SDNN values (ms), (B) Normalized CVRR values (n.u.) and (C) Normalized STD HR (beats / min). Normalized values of each parameter are calculated by subtracting the parameter value for white background from the values for each of the background / overlay colors. Bar plots show the normalized data for all background and overlay colors (overlay colors labeled with "o" on x-axis), where second and third grader’s values are presented with blue and red colored bars, respectively. Error bars denote standard errors of the mean.

