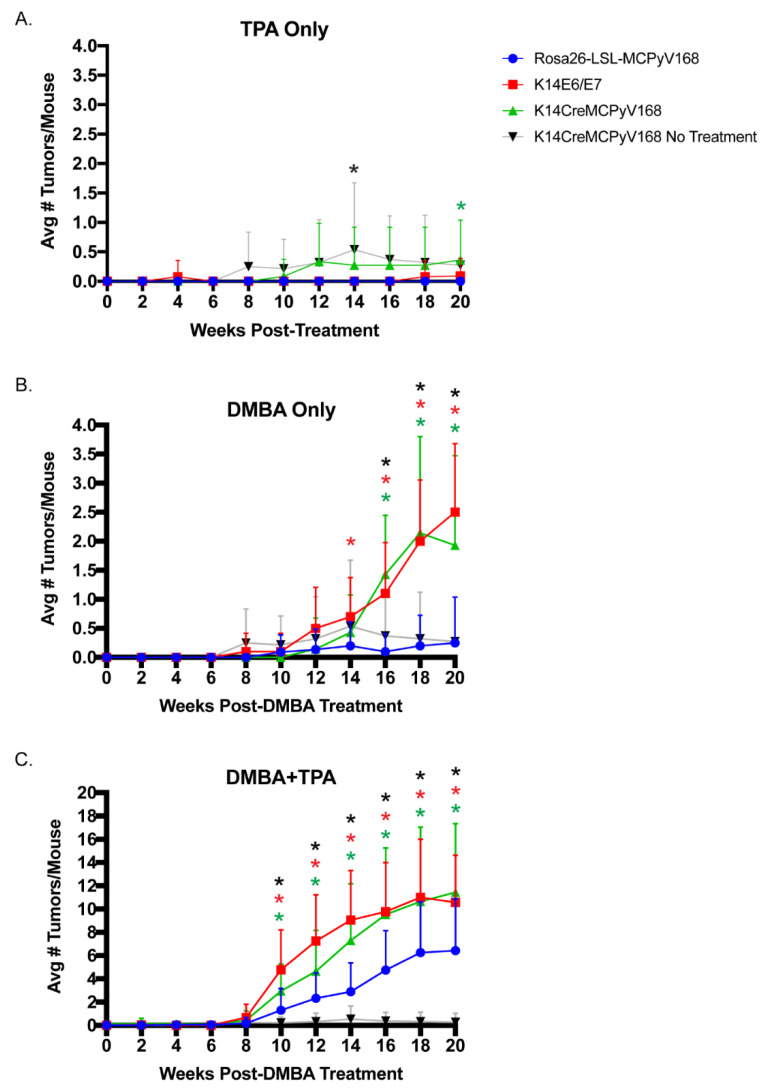
Figure 2.
The MCPyV T antigens function as tumor promoters, not initiators, in murine skin and synergize with chemical carcinogens to exacerbate skin tumorigenesis. Groups of Rosa26-LSL-MCPyV168 (blue data points), K14E6/E7 (red data points), and K14Cre-MCPyV168 (green data points) mice were treated topically with (A) 15 nmol of TPA twice a week for 20 weeks, (B) one time with 0.3 μmol DMBA, or (C) treated one time with 0.01 μmol DMBA and then twice a week for 20 weeks with 15 nmol TPA. Tumor incidence over time in an untreated group of K14Cre-MCPyV168 mice is also included (black data points). At each time point, the average number of tumors/mouse in each group was calculated by dividing the total number of tumors by the total number of mice in each group. Group sizes were adjusted when necessary. A two-sided Wilcoxon rank-sum test was performed on data from each time point to compare the average number of tumors per mouse. Statistical significance is indicated with an asterisk for the comparisons indicated in the figure. Statistical significance indicated in (A) black asterisk: K14Cre-MCPyV168 No Treatment vs. Rosa26-LSL-MCPyV168 p = 0.05; green asterisk: K14Cre-MCPyV168 vs. Rosa26-LSL-MCPyV16 p = 0.05; (B) black asterisk: K14Cre-MCPyV168 No Treatment vs. K14Cre-MCPyV168 Treated p < 0.0004; red asterisk: K14E6/E7 vs. Rosa26-LSL-MCPyV168 p < 0.03; green asterisk: K14Cre-MCPyV168 vs. Rosa26-LSL-MCPyV168 p < 2 × 10⁻⁵; (C) black asterisk: K14Cre-MCPyV168 No Treatment vs. K14Cre-MCPyV168 Treated p < 1.6x10⁻⁹; red asterisk: K14E6/E7 vs. Rosa26-LSL-MCPyV168 p < 0.008; green asterisk: K14Cre-MCPyV168 vs. Rosa26-LSL-MCPyV168 p < 0.04. The number of mice per group is indicated in Table 1. Error bars indicate standard deviation.

