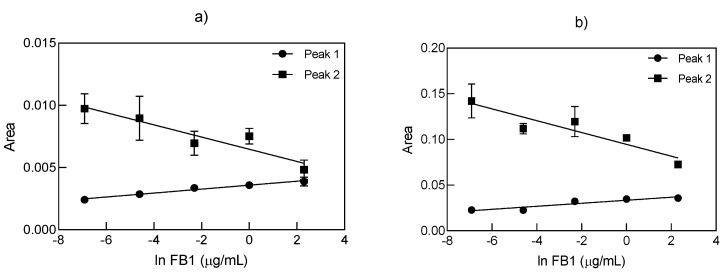
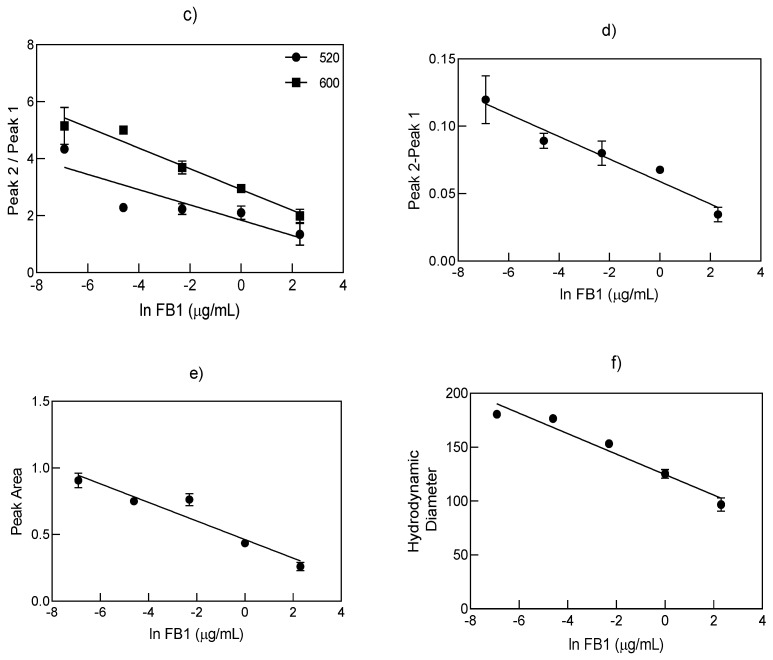
Figure 4.
Standard curves for the quantification of FB1 with aptamer 96 nt through the analysis of the AF4 fractograms from the UV-Vis peak areas at (a) 520 nm, (b) 600 nm, (c) peak ratio between Peak 2 (larger particles) and Peak 1 (smaller particles), (d) peak area differences at 600 nm, (e) MALS peak area at 28° and (f) hydrodynamic diameter determined by DLS for the Aptamer (96 nt)–FB1–AuNPs conjugates in NaCl 0.2 M (n = 3).


