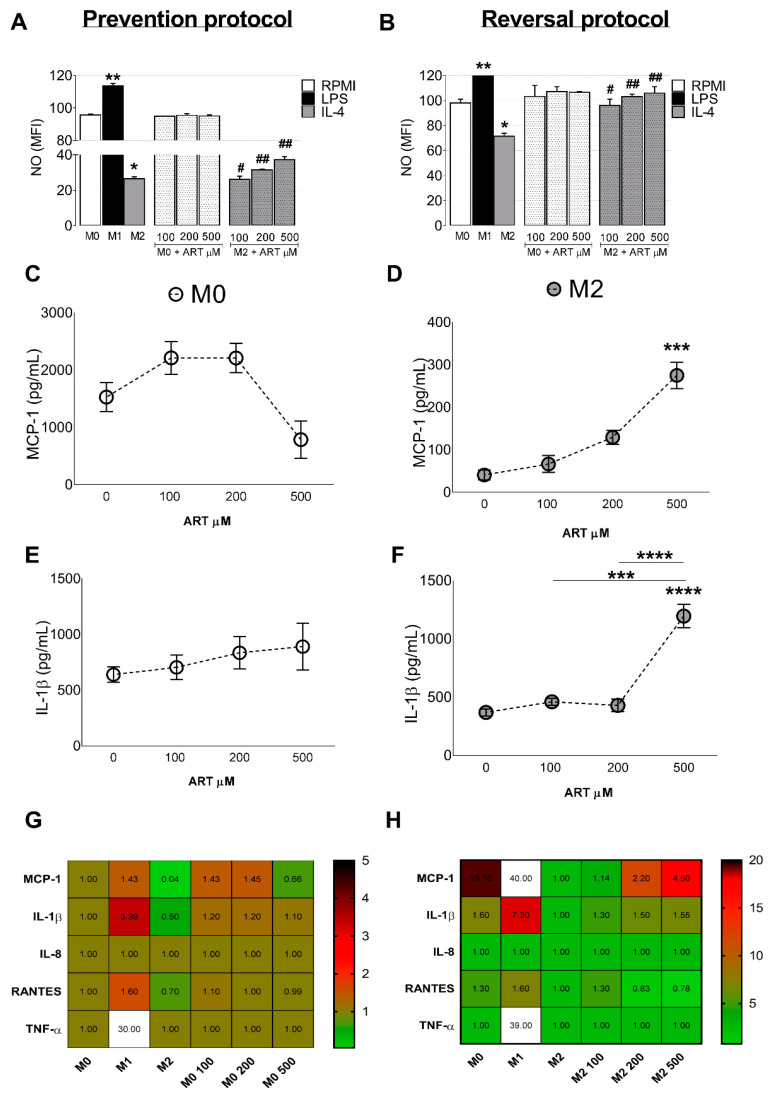
Figure 4.
ART treatment induces NO production and MCP-1/IL-1β release. Monocytes were treated with increased doses of ART (100, 200, and 500 µM) for 24 h in the prevention protocol in the presence or not of IL-4 (A). In the reversal protocol (B), cells were treated with IL-4 for 6 h and ART was then added in fresh medium for extra 18 h. NO production was measured by flow cytometry. Cytokine MCP-1 (C,D) and IL-1β (E,F) production was measured at the supernatant of cell culture by ELISA. Heat map showing fold change of all cytokines analyzed (G,H). Data represent mean ± SEM of at least three independent experiments performed in triplicate. Data were analyzed by ANOVA followed by Tukey post hoc. *, **, *** and, **** significantly different from control M0 cells (white bar). # and ##, significantly different from M2 cells (grey bar). M0: Naive control monocytes maintained in RPMI 10%, M1: positive control for inflammatory monocytes maintained in LPS and, M2: immunosuppressive monocytes maintained in IL-4.

