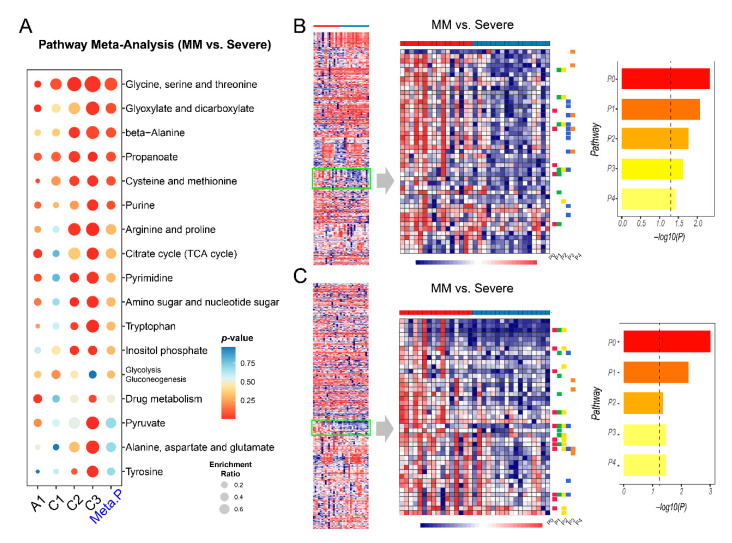
Figure 5.
Metabolic pathway analysis and cluster heatmap analysis between mild-to-moderate (MM) and severe groups. (A) Summary of pathway analysis and meta-analysis result. (B) Enrichment analysis on a pattern of interest identified in dataset A1 (negative ion mode). P0: Caffeine metabolism; P1: Glyoxylate and dicarboxylate metabolism; P2: Citrate cycle (TCA cycle); P3: Purine metabolism; P4: Lysine degradation. The vertical dashed line in the bar plot is the threshold of p = 0.05. (C) Enrichment analysis on a pattern of interest in A1 (positive ion mode). P0: Glycine, serine and threonine metabolism; P1: Glyoxylate and dicarboxylate metabolism; P2: Cysteine and methionine metabolism; P3: Citrate cycle (TCA cycle); P4: Selenocompound metabolism.

