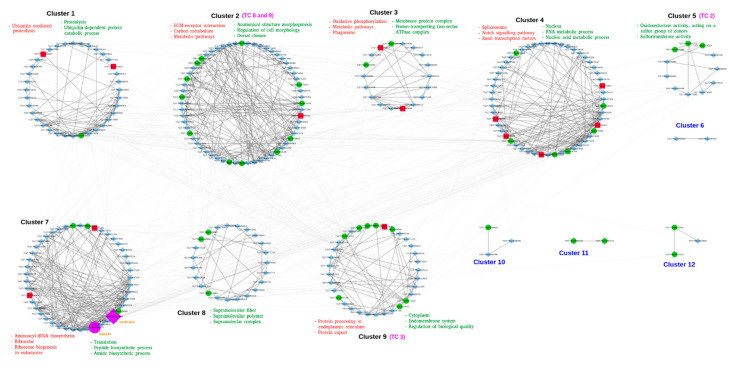
Figure 5.
Community analysis of the interaction network. Red, green, and cyan nodes represent up- (square), downregulated (circle), and STRING-predicted (diamonds) genes, respectively. Nodes in purple indicate the hub genes labeled with orange text. The topmost enriched KEGG pathways (red text), GO terms (green text), and transporter class (pink text) are mentioned for each cluster. Clusters with <10 nodes (blue text) were excluded from the analysis.

