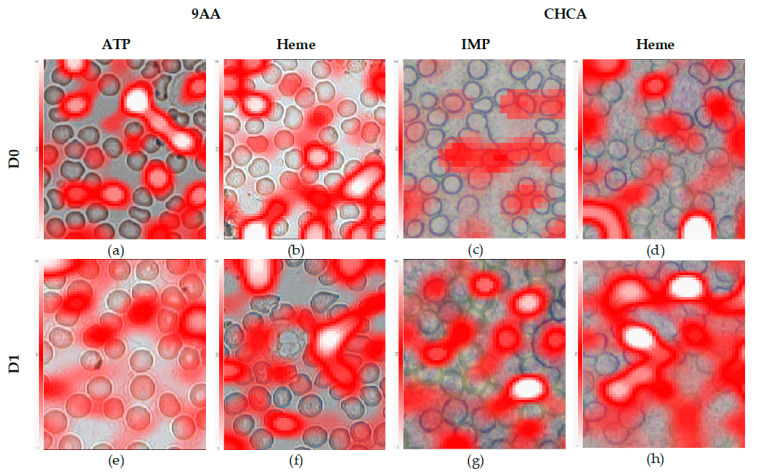
Figure 5.
Lateral distribution of cellular markers overlaid on light microscopy images: ATP (a,e), heme (b,d,f,h), and inosine monophosphate (IMP) (c,g). MSI (a–d) was recorded using the selected D0, while images (e–h) were recorded using selected D1 settings. The 9AA matrix and negative ionization were used for recording images (a,b,e,f). The CHCA matrix and positive ionization were used for recording images (c,d,g,h). Scale bar corresponds to 5 μm.

