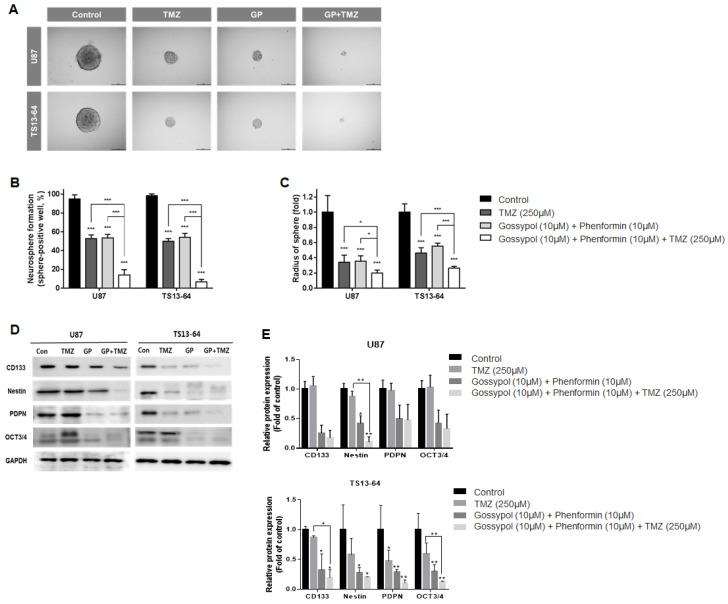
Figure 2.
Stemness evaluation of GBM TSs after combination drug administration of gossypol, phenformin and TMZ compared to control, TMZ monotherapy, and gossypol/phenformin dual therapy. Stemness of U87 (n = 17) and TS13-64 (n = 27) was measured 3 weeks after combination drug therapy with the aid of neurosphere formation assays. (A) Stemness was captured using ToupView software (Toup Tek Photonics) and (B) quantified as a percentage of sphere-positive wells and (C) sphere radius (scale bar = 50 µm). (D) Level of protein related to stemness (CD 133, Nestin, PDPN, and Oct 3/4) were measured via western blot analysis. (E) Protein band intensities were quantified via densitometry. GAPDH was used as a loading control (mean ± SD; asterisks over each bar represent significant differences compared to control; * p < 0.05, ** p < 0.01, *** p < 0.001).

