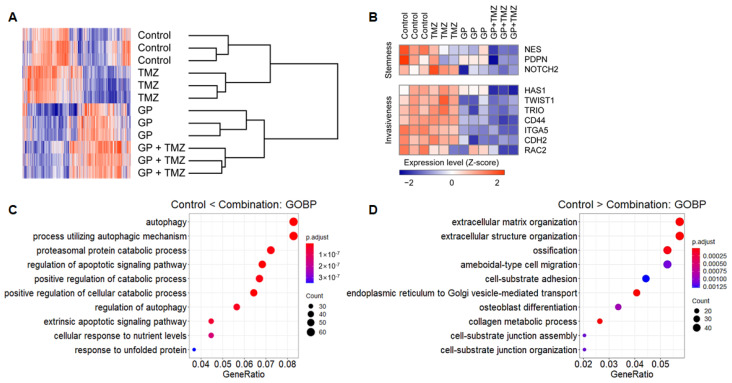
Figure 4.
U87 cells were treated with gossypol, phenformin, and TMZ for 72 h, and gene expression profile was obtained using microarray. (A) For genes with average expression levels of top 30%, average linkage hierarchical clustering was performed with Euclidean distance as a distance metric, and expression levels were depicted as a heat map using GENE-E software. (B) Expression levels of stemness- and invasiveness-associated genes were displayed as a heat map. (C,D) Among 1799 DEGs between control and combination groups, expression levels of 837 genes, which were up-regulated in the combination group (C) and the expression levels of 962 genes, which were down-regulated in the combination group (D) were functionally annotated using GO terms.

