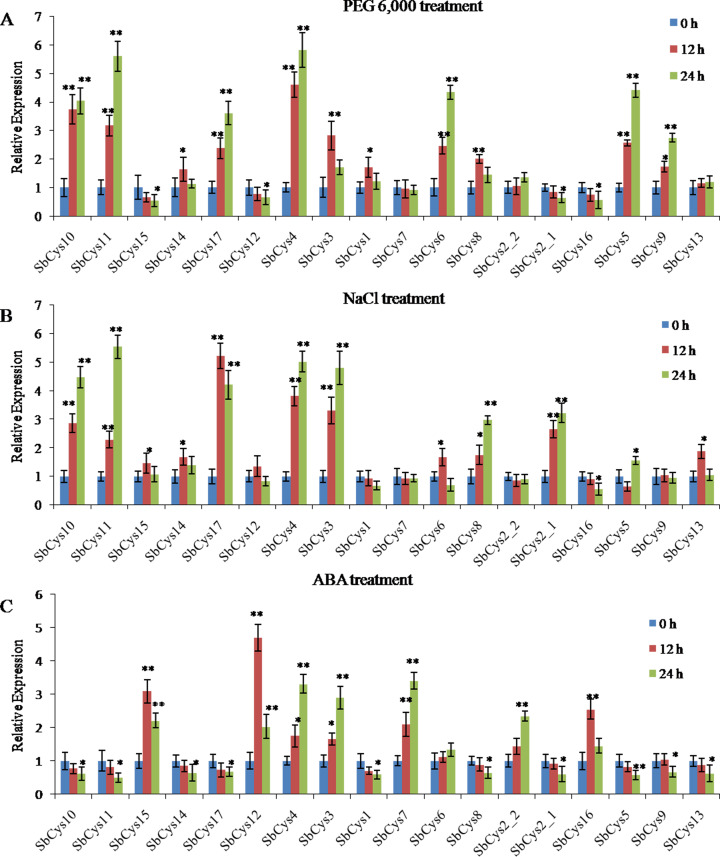
Figure 11. Expression patterns of SbCys. genes under (A) dehydration (PEG 6,000) treatment, (B) salt shock (NaCl) treatment, and (C) ABA treatment.
qRT-PCR was used to investigate the expression levels of each SbCys gene. To visualize the relative expression levels data, 0 h at each treatment was normalized as “1”. * indicated significant differences in comparison with the control at p ≤ 0.05. ** indicated significant differences in comparison with the control at p ≤ 0.01.

