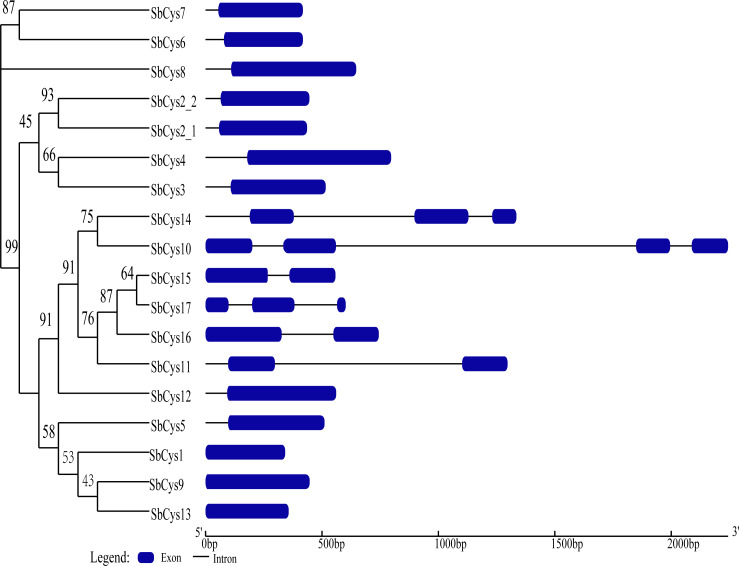
Figure 2. Phylogenetic relationship and gene structure of SbCys genes.
A phylogenetic tree was constructed using MEGA X by the maximum likelihood method with 1000 bootstrap replicates. Exon/intron structures were identified by online tool GSDS. Lengths of exons and introns of each SbCys genes were exhibited proportionally. Exons and introns are shown by blue bars and black horizontal lines, respectively.

