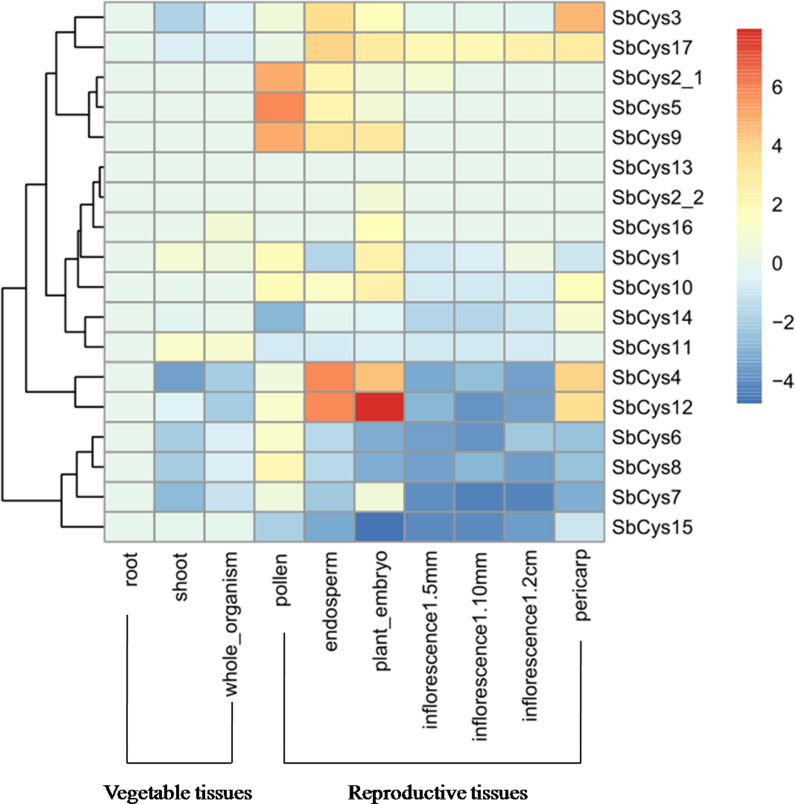
Figure 8. Hierarchical clustering of the expression profiles of SbCys genes in different tissues.
Different tissues are exhibited below each column. Root, shoot, and whole organism belonged to vegetable tissues were collected at 14 days after Sorghum seed germination. Reproductive tissues included embryo , endosperm and pericarp were collected at 20 days after pollination; pollens at booting stage; inflorescences based on sizes: 1–5 mm, 5–10 mm, and 1–2 cm. Log transform data was used to create the heatmap. The scale bar represented the fold change (color figure online). Blue blocks represented the lower expression level and red blocks represented the higher expression level.

